Заглавная страница Избранные статьи Случайная статья Познавательные статьи Новые добавления Обратная связь FAQ Написать работу КАТЕГОРИИ: ТОП 10 на сайте Приготовление дезинфицирующих растворов различной концентрацииТехника нижней прямой подачи мяча. Франко-прусская война (причины и последствия) Организация работы процедурного кабинета Смысловое и механическое запоминание, их место и роль в усвоении знаний Коммуникативные барьеры и пути их преодоления Обработка изделий медицинского назначения многократного применения Образцы текста публицистического стиля Четыре типа изменения баланса Задачи с ответами для Всероссийской олимпиады по праву 
Мы поможем в написании ваших работ! ЗНАЕТЕ ЛИ ВЫ?
Влияние общества на человека
Приготовление дезинфицирующих растворов различной концентрации Практические работы по географии для 6 класса Организация работы процедурного кабинета Изменения в неживой природе осенью Уборка процедурного кабинета Сольфеджио. Все правила по сольфеджио Балочные системы. Определение реакций опор и моментов защемления |
Prices of Substitute ResourcesСодержание книги
Поиск на нашем сайте
A given good or service can usually be produced in many different ways. We could use various combinations of resources. Example: The Chinese didn’t have many capital goods available so when they built a factory they used a very labor-intensive method of construction. Thousands of workers dug the hole for the foundation carting off the dirt in wicker baskets. In America is a great deal of capital equipment, they use a capital-intensive method of production. Bulldozers and other earth-moving equipment get the job done with much less labor. In each country, the cheapest production method is used China happens to be a labor-intensive country because capital is relatively expensive. In the United States, they use a capital-intensive method because labor is relatively expensive.
Marginal Revenue Product (MRP)
The demand for resources is derived mainly from the demand for the final product. Resource productivity and the relative prices of other resources that can be substituted also help determine price. Now we're ready to see how a firm decides how much of a resource to purchase. How much of a resource a firm will purchase depends on three things: (1) the price of that resource, (2) the productivity of that resource, (3) the selling price of the final product that the resource helps to produce. Marginal output, or marginal physical product, is the additional output produced by one more unit of a resource. Marginal cost is the cost of producing one additional unit of output. Marginal revenue is the additional revenue for selling one more unit of output. Marginal revenue product is the additional revenue obtained by selling the output produced by one more unit of a resource. Example: In Table 1, we have an output schedule for a firm that is using up to 10 units of labor. Marginal physical product is simply the additional output produced by one more unit of input (in this case, one more unit of labor). Table 1 Hypothetical Output of Labor Hired by a Firm
Notice the marginal physical product was zero with the 8th worker and negative with the 9th and 10th workers. The 8th worker added nothing to output, while the 9th and 10th workers were actually in the way. No business firm would hire more than seven workers under these circumstances, even if the wage rate were a penny an hour. In Table 2, we've added a column — price. Why is it always the same no matter how large output is? Because in this case we're dealing with a perfect competitor. If a monopolist, monopolistic competitor, or oligopolist wants to sell more, he must lower price. Now for the fifth column, total revenue product. Try your luck on that one. Table 2 Hypothetical Marginal Revenue Product Schedule
Productivity and Marginal Physical Product. The relation between productivity and marginal physical product, or marginal output, could stand some clarification. Suppose a machine operator produced 100 units per hour. That’s her productivity. A second machine operator is hired. If their combined output is 198 then their average productivity is 99 (198/2 = 99). We can also say that the marginal output, or marginal physical product, of the second worker is 98. However, we re not saying that the second worker is not as productive as the first worker, but just that if a second worker were added, output would rise by 98. MRP is the additional revenue obtained by selling the output produced by one more unit of a resource. MRP is the difference in total revenue product between units of land. There’s a much easier way of finding the marginal revenue product. Just multiply the marginal physical product by the price. This works for the perfect competitor unfortunately it doesn’t work for me imperfect competitor. To avoid confusion as well as to ensure that we get the right answers when we find the MRP for the imperfect competitor let s slick with our method of using total revenue product to find the MRP. Let's work out one more MRP schedule (Table 3). Table 3 Hypothetical MRP Schedule
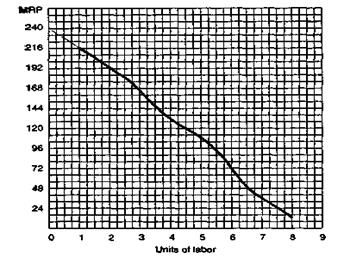
Graphing the MRP In Figure 1, we've drawn a graph of the MRP schedule shown in Table 2. This curve represents the firm's demand curve for land. As you would expect, it slopes downward to the right.
Figure 1. Graph of the MRP schedule (Table 2)
In Figure 1, we've assumed a rent of $120. How many units of land are hired? Four. How much rent is collected (total rent)? $480 (4 x $120). Notice there is what we call the producer's surplus in the triangular area at the top of Figure 1. This is the difference between how much this land is worth to the firm and how much it actually had to pay in rent. How much it actually paid in rent is shown in the rectangle below the triangle. Producer's surplus parallels consumer's surplus (how much consumers would have been willing to pay for a final product minus how much they had to pay). Now we'd like to draw a graph of the MRP schedule shown in Table 3. Draw it in the space provided in Figure 2.
Figure 2. Graph of the MRP schedule (Table 3)
|
|||||||||||||||||||||||||||||||||||||||||||||||||||||||||||||||||||||||||||||||||||||||||||||||||||||||||||||||||||||||||||||||||||||||||||||||||||||||
|
|
Последнее изменение этой страницы: 2016-09-13; просмотров: 252; Нарушение авторского права страницы; Мы поможем в написании вашей работы! infopedia.su Все материалы представленные на сайте исключительно с целью ознакомления читателями и не преследуют коммерческих целей или нарушение авторских прав. Обратная связь - 3.22.68.29 (0.007 с.) |