Заглавная страница Избранные статьи Случайная статья Познавательные статьи Новые добавления Обратная связь FAQ Написать работу КАТЕГОРИИ: ТОП 10 на сайте Приготовление дезинфицирующих растворов различной концентрацииТехника нижней прямой подачи мяча. Франко-прусская война (причины и последствия) Организация работы процедурного кабинета Смысловое и механическое запоминание, их место и роль в усвоении знаний Коммуникативные барьеры и пути их преодоления Обработка изделий медицинского назначения многократного применения Образцы текста публицистического стиля Четыре типа изменения баланса Задачи с ответами для Всероссийской олимпиады по праву 
Мы поможем в написании ваших работ! ЗНАЕТЕ ЛИ ВЫ?
Влияние общества на человека
Приготовление дезинфицирующих растворов различной концентрации Практические работы по географии для 6 класса Организация работы процедурного кабинета Изменения в неживой природе осенью Уборка процедурного кабинета Сольфеджио. Все правила по сольфеджио Балочные системы. Определение реакций опор и моментов защемления |
Monopolistic Competition DefinitionСодержание книги
Поиск на нашем сайте
A monopolistically competitive industry has many firms selling a differentiated product. How many is many? So many that no one firm has any significant influence over price. Although this is our working definition, monopolistic competitors do have some influence over price because their products are differentiated. But it's a very small influence.
The monopolistic competitor in the short and long runs The monopolistic competitor in the short run Like the perfect competitor, the monopolistic competitor can make a profit or take a loss in the short run; but in the long run, the firm will break even. The reason the monopolistic competitor makes zero economic profits in the long run is the same as that under perfect competition. In the long run, if firms are losing money, many will leave the industry, lowering industry supply and raising market price. And if, in the long run, firms are realizing substantial profits, new firms will be attracted to the industry, thus raising supply and lowering market price. But we're getting ahead of ourselves since we're only beginning the short run.
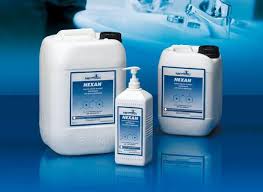
Figure 1.Monopolistic competitor in the short run When MC equals MR, output is 60. We find that at an output of 60, the price, which we read off the demand curve, is $15, and the ATC is $12.10 or so. Now we can write down our standard equation, substitute, and solve: Total profit =(Price - ATC)xOutput=($15 - $12.10)x60 =$2.90x60 = $174 Now we're ready for Figure 2, which also shows the monopolistic competitor in the short run.
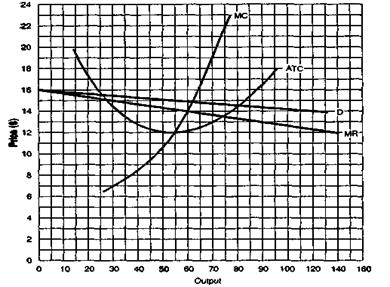
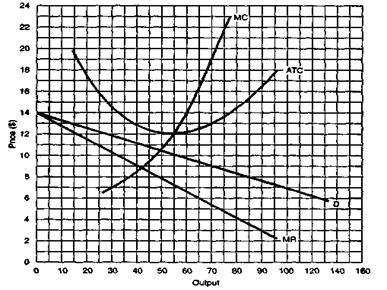
Figure 2.Monopolistic competitor in the short run Total profit = (Price - ATC) xOutput= ($11-$12.80)x42 =-$1.80x42 = -$75.60 The monopolistic competitor in the long run In the long run the monopolistic competitor makes zero economic profits. If there are short-run profits, more firms will enter the industry, driving down market price and profits. If there are losses, some firms will leave the industry, pushing up market price and reducing losses. Figure 3 is a model of the monopolistic competitor in the long run. Notice how the point at which the MC and MR curves cross is directly below the price. Output is 40, and price is $12 25 Notice also that price is equal to ATC at that output. At any other output, the demand curve lies below the ATC curve, so price is less than ATC. Notice that the price in Figure 3 is higher than the minimum point of the ATC curve. This means that in the long run, price is higher under monopolistic competition than it is under perfect competition.
Figure 3. Monopolistic competitor in the long run To sum up, both the monopolistic competitor and the perfect competitor make zero economic profits in the long run. The monopolistic competitor charges a higher price and has a lower output than the perfect competitor and the perfect competitor is a more efficient producer than the monopolistic competitor.
Product Differentiation
Product differentiation is crucial to monopolistic competition. In fact, product differentiation is really what stands between perfect competition and the real world. People differentiate among many similar products. What makes one good or service differ from another? We need only for the buyer to believe it's different, because product differentiation takes place in the buyer's mind. In the real world, however, buyers generally do differentiate. We're always differentiating, and it doesn't have to be based on taste, smell, size, or even any physical differences among the products.
Figure 4. The Typical Monopolistic Competitor
Price Discrimination
Price discrimination occurs when a seller charges two or more prices for the same good or service. The most notorious example of price discrimination was probably that of A&P during the 1940s. A&P had three grades of canned goods: A, B, and C. Grade A was presumably of the highest quality, B was fairly good, and C was— well, C was edible. My mother told me that she always bought grade A, even though it was the most expensive. Nothing but the best for our family. Our family was friendly with another family in the neighborhood. The husband, a man in his early 50s, found out he had stomach cancer. "Aha!" exclaimed my mother, "Mrs. S. always bought grade C!" A few years later the Federal Trade Commission (FTC) prohibited A&P from selling grades A, B, and C. The FTC didn't do that because of Mr. S.'s stomach cancer, but because there was absolutely no difference among the grades. Why had A&P concocted this elaborate subterfuge? Because it was worth tens of millions of dollars in profits! Take a can of green peas that had a demand schedule like the one in Table 1. To keep things simple, suppose A&P had a constant ATC of 20 cents a can. How much should it charge? To figure this out, add a total cost column to Table 1 and then a total profits column. Now figure out the total profits at prices of 50 cents, 40 cents, and 30 cents, respectively. In Table 2, these calculations are all worked out. If A&P could charge only one price, it would be 50 cents; total profit would be $30. Now let's see how much profit would be if A&P were able to charge three different prices.
Table 1 Hypothetical Demand Schedule for Canned Peas
At 50 cents, A&P would be able to sell 100 cans. These are sold to the people who won't buy anything if it isn't grade A. Then there are those who would like to buy grade A but just can't afford it. These people buy 40 cans of grade B. Finally, we have the poor, who can afford only grade C; they buy 30 cans. Table 2 Hypothetical Demand Schedule for Canned Peas
All this is worked out in Table 3. Total revenue now is $75 for the 170 cans sold, and total cost of 170 cans remains $34. This gives A&P a total profit of $41. Table 3 Hypothetical Demand Schedule for Canned Peas, by Grades
Why is total profit so much greater under price discrimination ($41) than it is under a single price ($30)? Total profit would be $30 at 50 cents; it would be $28 at 40 cents; it would be $17 at 30cents. Because the seller is able to capture some or all of the consumer's surplus. People are willing to buy only 100 cans at 50 cents, 40 more at 40 cents, and another 30 at 30 cents. But the people who buy only grade A will buy all their cans of green peas at that price, while those buying grade B will buy all their peas at 40 cents and grade C buyers will buy all their peas at 30 cents. By keeping its markets separate rather than charging a single price, A&P had been able to make much larger profits. The firm that practices price discrimination needs to be able to distinguish between two or more separate groups of buyers. In addition to distinguishing among separate groups of buyers, the price discriminator must be able to prevent buyers from reselling the product (i.e., stop those who buy at a low price from selling to those who would otherwise buy at a higher price).
|
||||||||||||||||||||||||||||||||||||||||||||||||||||||||||||||
|
|
Последнее изменение этой страницы: 2016-09-13; просмотров: 342; Нарушение авторского права страницы; Мы поможем в написании вашей работы! infopedia.su Все материалы представленные на сайте исключительно с целью ознакомления читателями и не преследуют коммерческих целей или нарушение авторских прав. Обратная связь - 3.148.117.240 (0.008 с.) |

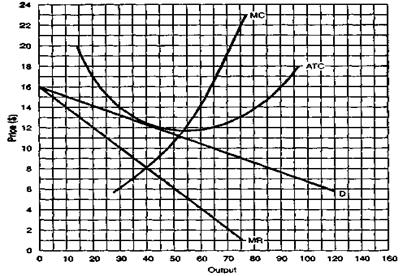
 The monopolistic competitor faces a more elastic, or flatter, demand curve than the monopolist.