Заглавная страница Избранные статьи Случайная статья Познавательные статьи Новые добавления Обратная связь FAQ Написать работу КАТЕГОРИИ: ТОП 10 на сайте Приготовление дезинфицирующих растворов различной концентрацииТехника нижней прямой подачи мяча. Франко-прусская война (причины и последствия) Организация работы процедурного кабинета Смысловое и механическое запоминание, их место и роль в усвоении знаний Коммуникативные барьеры и пути их преодоления Обработка изделий медицинского назначения многократного применения Образцы текста публицистического стиля Четыре типа изменения баланса Задачи с ответами для Всероссийской олимпиады по праву 
Мы поможем в написании ваших работ! ЗНАЕТЕ ЛИ ВЫ?
Влияние общества на человека
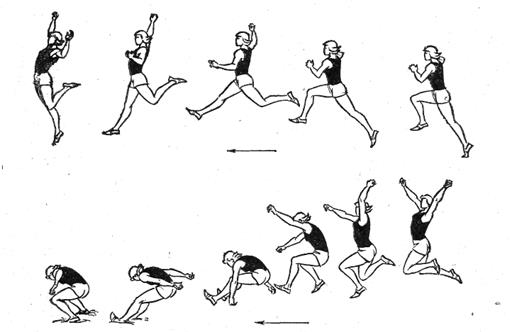
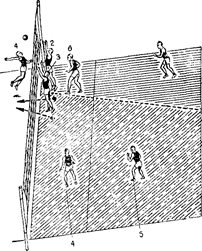
Приготовление дезинфицирующих растворов различной концентрации Практические работы по географии для 6 класса Организация работы процедурного кабинета Изменения в неживой природе осенью Уборка процедурного кабинета Сольфеджио. Все правила по сольфеджио Балочные системы. Определение реакций опор и моментов защемления |
Meta-Analysis of Environmental Intensities for FoodsСодержание книги
Поиск на нашем сайте
Food Group Retail Level Food Losses (Percentage)b Consumer Level Food Losses (Percentage)b Total Retail and Consumer Level Food Losses (Percentage)b Current Caloric Consumptionc Caloric Consumption (Dietary Scenario 1)d Caloric Consumption (Dietary Scenario 2)e Caloric Consumption (Dietary Scenario 3)f Fruits/Fruit Juice 11% 28% 40% Processed Fruits 6% 15% 21% Vegetables 11% 21% 32% Processed Vegetables 6% 15% 21% Fluid Milk 12% 20% 32% Other Dairy Products 8% 20% 29% Grains 12% 19% 31% Protein -- -- -- Meat 5% 23% 28% Poultry 4% 17% 21% Eggs 7% 21% 28% Fish/Seafood 8% 32% 40% Nuts, seeds, soy 6% 11% 17% Added sugars 11% 29% 40% Solid Fats 19% 20% 39% Oils 19% 20% 39% Total -- -- -- 3,620 3,300 3,560 3,260 a Caloric consumption estimates include Calories associated with food losses at the retail and consumer levels. b Source of food loss estimates: US Department of Agriculture 2014b; Buzby et al. 2014 c Current Caloric consumption estimates are obtained by applying the food loss percentages at the retail and consumer levels to the current Caloric intake estimates shown in Table 2 above. d Dietary Scenario 1 accounts for a reduction in Caloric intake only, without shifting the current US diet to the USDA recommended food mix. Food losses at the retail and consumer levels are applied to the Caloric intake estimates for dietary Scenario 1 to obtain Caloric consumption values. e Dietary Scenario 2 accounts for a shift to the USDA recommended food mix only, without reducing total Caloric intake. Food losses at the retail and consumer levels are applied to the Caloric intake estimates for dietary Scenario 2 to obtain Caloric consumption values. f Dietary Scenario 3 accounts for both a reduction in Caloric intake and a shift to the USDA recommended food mix. Food losses at the retail and consumer levels are applied to the Caloric intake estimates for dietary Scenario 3 to obtain Caloric consumption values. The information presented in Table 4 is drawn from published life-cycle assessment (LCA) studies for food products evaluated in our study. The minimum and maximum values shown represent the minimum and maximum intensity factors found in the literature. The average estimates are the averages of all intensity values obtained for each food type. Some sources provide multiple estimates for the same food type to account for differences in geographic location, production methods, and/or cooking requirements. The total number of intensity values used in our analysis is displayed in the column, “Number of Estimates.” Additionally, proxies are used for food types for which data is unavailable. Proxies are displayed under the column, “Number of Sources.” This column also provides the number of studies contributing to the intensity factor estimates for each food type. Table 5 presents the underlying data for the cumulative energy intensity values used in this analysis. Although the majority of food consumed in the US is also produced in the US (approximately, 83% by weight according to the USDA (2015)), there is a lack of US-based LCA studies for food products, particularly in terms of energy use. Hence, energy use estimates were taken from an extensive collection of both domestic and foreign-based LCA studies to account for all food types in our study, as well as to capture the full spectrum of energy intensity values for different locations, production processes, technologies, system boundaries, etc. The USDA Loss-Adjusted Food Availability Data Set (2014b) was used to develop conversion factors that allowed us to transform energy use intensities from MJ/kg to MJ/kCal. Table 6 presents the underlying data for the cumulative water intensity values used in this analysis. Two of the most comprehensive LCAs for the water footprints of food products were conducted by Mekonnen and Hoekstra (2011, 2012). We therefore, retrieve the majority of our water intensity values from these two sources - the exception being estimates for seafood products, which are not included in their analyses. Mekonnen and Hoekstra (2011, 2012) provide green, blue, and grey water footprints for over 400 agricultural and animal products produced worldwide. Since the majority of our food is produced in the US, we use their US-based blue water footprint estimates, which include water use within the food supply chain from farm to retail. Their water footprints for agricultural products are weighted averages for crop production and various production and irrigation methods used across the US, while their animal product water footprints are weighted averages for different livestock production practices (grazing, industrial, and mixed) implemented across the country. Additionally, we incorporate global averages from Mekonnen and Hoekstra (2011, 2012) for each food product in our analysis to account for US consumption of food produced overseas. Identifying import statistics for each food type by country of origin is beyond the scope of this project; therefore, we use global averages to expand our range of blue water intensity values. The USDA Loss-Adjusted Food Availability Data Set (2014b) was used to develop conversion factors that allowed us to transform water use intensities from liters/kg to liters/kCal. The greenhouse gas (GHG) emissions estimates are not shown here. However, we used the GHG emissions factors from the Heller and Keoleian (2014) study. The GHG estimates are provided in their online Supporting Information.
|
||||
|
|
Последнее изменение этой страницы: 2024-06-17; просмотров: 4; Нарушение авторского права страницы; Мы поможем в написании вашей работы! infopedia.su Все материалы представленные на сайте исключительно с целью ознакомления читателями и не преследуют коммерческих целей или нарушение авторских прав. Обратная связь - 3.144.117.167 (0.008 с.) |