Заглавная страница Избранные статьи Случайная статья Познавательные статьи Новые добавления Обратная связь FAQ Написать работу КАТЕГОРИИ: ТОП 10 на сайте Приготовление дезинфицирующих растворов различной концентрацииТехника нижней прямой подачи мяча. Франко-прусская война (причины и последствия) Организация работы процедурного кабинета Смысловое и механическое запоминание, их место и роль в усвоении знаний Коммуникативные барьеры и пути их преодоления Обработка изделий медицинского назначения многократного применения Образцы текста публицистического стиля Четыре типа изменения баланса Задачи с ответами для Всероссийской олимпиады по праву 
Мы поможем в написании ваших работ! ЗНАЕТЕ ЛИ ВЫ?
Влияние общества на человека
Приготовление дезинфицирующих растворов различной концентрации Практические работы по географии для 6 класса Организация работы процедурного кабинета Изменения в неживой природе осенью Уборка процедурного кабинета Сольфеджио. Все правила по сольфеджио Балочные системы. Определение реакций опор и моментов защемления |
Integration in the global economy (trade, FDI)Содержание книги
Поиск на нашем сайте
The productivity of Ukrainian enterprises depends on investment in modern equipment, their capacity to adapt this to customer requirements and to offer additional services or added-value vis-а-vis their competitors. The growth of an economy is often directly linked to gains in investment- and efficiency-driven productivity. Such gains, on the other hand, are made possible by alignment of production standards to foreign markets and investors attracted to invest in the national economy both with money and with knowledge sources in order to help national enterprises in catching up to more developed markets on a higher technological level. However, as the “Innovation Performance Review for Ukraine” states, “Ukraine is poorly integrated in global value chains, with research showing it to be outside both “buyer-driven” networks (e.g., clothing), as well as “producer-driven” global networks, including trade in parts and final manufacturing products”. 35
Ukraine’s integration into the GVC (Global Value Chain) through FDI (Foreign Direct Investment) and external trade patterns is examined in this chapter.
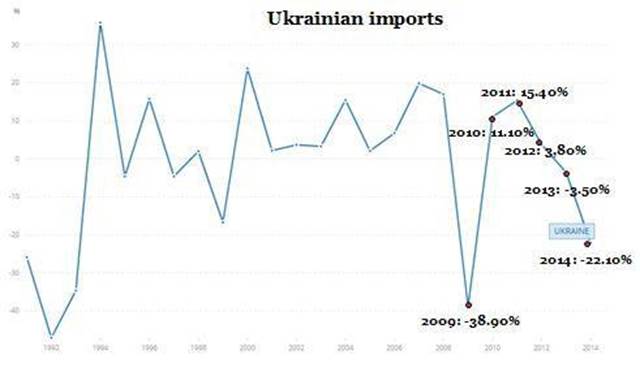
Figure 6 below provides an overview on Ukraine’s balance in imports of goods and services, ranging back until 1991 (the year, when the country became independent). Evident is the significant drop in imports in 2009, when net imports decreased by 38.90%. The drop in import numbers in 2009 must be seen against the backdrop of the gas crisis at that time, when Russia stopped supplying Ukraine (and, as a matter of fact, Europe) with gas for several weeks.36 From 2010 to 2012 the number of imports began to grow again, however since 2013 the net number is again negative. In 2014 Ukraine experienced a similar cut in its import numbers remembering of those in 1992 and 2009 (see figure below).
Figure 6: Ukraine’s import rate of goods and services (annual growth in %); source = World Bank
Open Economic Data
35 World Bank, 2005, From Disintegration to Reintegration: Eastern Europe and the Former Soviet Union in International Trade, Edited by Harry G. Broadman, Chapter 7, cited in: United Nations Economic Commission for Europe: “Innovation Performance Review Ukraine”, New York and Geneva, 2013, p.50
36 See here for an example of media reports on the gas crisis in 2009: http://www.economist.com/news/briefing/21600111-reducing-europes-dependence-russian-gas-possiblebut-it-will-take-time-money-and-sustained: accessed on 2 May 2016.
Looking more closely on the composition of imports in Ukraine, the most important goods imported are:
· High-tech imports
· Communications, computer and information services imports
· Energy (mainly natural gas)
· Advanced agricultural machinery
· New and used passenger cars
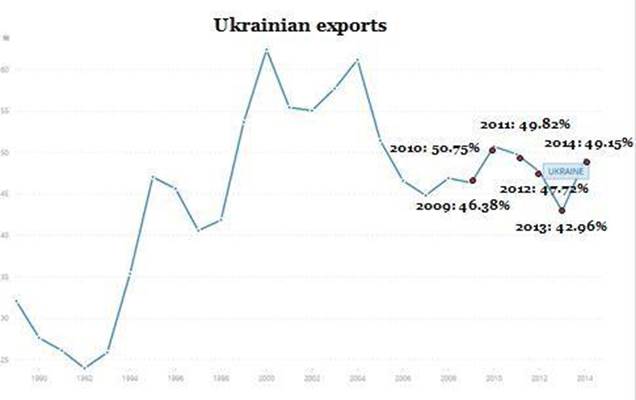
The next Figure 7 compares Ukraine’s export rate of goods and services to the annual GDP. Since 1991, Ukraine had the highest export rate in 2000, amounting to 62.44% of the total GDP in that year.
More recently, Ukraine’s export rate was more or less stable and reached between 40% and 50% of GDP.
In 2014, exports contributed nearly to half of the total Ukrainian GDP. Obviously, exports are decisive for the prosperity of Ukraine’s economy, hence, for the well-being of the country. Ukraine relies on a strong performance of its export-oriented sectors, such as heavy engineering, oil, gas and chemical engineering and ferrous and non-ferrous metallurgy.
The export of high-tech products, on the other hand, is still weak in its performance. In 2013, for instance, high-tech exports made up only 2.42% of Ukraine’s total trade volume.37 In 2013, the high-tech merchandised exports of Ukraine accounted for 49.3 USD per capita, which is considerably higher than in 2008 (33.5 USD per capita) and also in Turkey (34.8) or Brazil (45.0), but lower than the Russian Federation (63.7), Tunisia (72.6) or Belarus (82.2).38
Figure 7: Ukraine’s export rate of goods and services as compared to the annual GDP (% of GDP); source = World Bank Open Economic Data
37 United Nations, COMTRADE database; Eurostat ’High-technology’ aggregations based on SITC Rev. 4; WTO Trade in Commercial Services database, cited in: The Global Innovation Index 2015, p.372
38 UNESCO Science Report 2015
There has been little change in the export structure over the past decade. Observed shifts have been to some extent explained by price fluctuations in key export sectors such as steel and agricultural production. Metallurgy products still dominate exports according to data from the United Nations Innovation Performance Review 2013 for Ukraine39. Exports of agricultural and food products have remained resilient throughout the crisis, accounting for 25% of total exports in this period. Mineral products and chemicals are also important exports. Altogether, these define a concentrated export structure dominated by low value-added goods where price volatility is a source of vulnerability.
The CIS (Commonwealth of Independent States) is the largest trading partner, accounting foran average 36% of exports and 44% of imports over 2009-2011. Over the same period, the EU shares were 26% and 32%, respectively.40 Asia is also an important destination for Ukrainian exports, accounting for 28% of total exports. While Ukraine is able to export more sophisticated products to CIS markets, its machine building products have not been upgraded over time to penetrate other markets successfully. There are, however, exceptions to that especially with regards to military equipment. For instance, Ukraine supplied 80% of engines to Russian-made helicopters and turbines for military vessels.
FDI in Ukraine plays still a minor role. Ukraine is far from competing with top-attracting FDIcountries, such as Hong Kong (China), Luxembourg, Mozambique or Ireland, whose FDI inflows in 2013 ranged between 20% and 50% of the national GDP. Ukraine, in the same year, attracted only 2.13% of FDI as compared to the national GDP. The FDI outflow from Ukraine into other countries in 2013 was even lower, amounting to 0.24% of the GDP of that year.41 Also compared to economically more advanced countries in Central and Eastern Europe, both FDI inflow and outflow levels remain relatively low.
FDI is important because it supports economic development through the transfer of technology and managerial skills and through the creation of employment opportunities. According to the United Nations Conference on Trade and Development (UNCTAD) 2012 World Investment Report, Ukraine is a transition economy with FDI inflows of more than USD 5 billion and outflows of less than USD 0.5 billion.42 The top investors to Ukraine over the past several years have been the United States (12%), Germany (12%), Russia (10%), and France (8%). In 2010, the largest investors came from the European Union (54%) and Russia (16%).43 It is, however, worthwhile to mention that Cyprus is a key foreign investor to Ukraine with more than one third of total FDI. Although investments from Cyprus are attributed to the category of investments from the EU, the country is also heavily used for reinvestment of Ukrainian and Russian money into the Ukrainian economy.
3. GOVERNANCE OF THE R&I SYSTEM
|
||
|
|
Последнее изменение этой страницы: 2017-01-24; просмотров: 110; Нарушение авторского права страницы; Мы поможем в написании вашей работы! infopedia.su Все материалы представленные на сайте исключительно с целью ознакомления читателями и не преследуют коммерческих целей или нарушение авторских прав. Обратная связь - 216.73.216.214 (0.009 с.) |