Заглавная страница Избранные статьи Случайная статья Познавательные статьи Новые добавления Обратная связь FAQ Написать работу КАТЕГОРИИ: ТОП 10 на сайте Приготовление дезинфицирующих растворов различной концентрацииТехника нижней прямой подачи мяча. Франко-прусская война (причины и последствия) Организация работы процедурного кабинета Смысловое и механическое запоминание, их место и роль в усвоении знаний Коммуникативные барьеры и пути их преодоления Обработка изделий медицинского назначения многократного применения Образцы текста публицистического стиля Четыре типа изменения баланса Задачи с ответами для Всероссийской олимпиады по праву 
Мы поможем в написании ваших работ! ЗНАЕТЕ ЛИ ВЫ?
Влияние общества на человека
Приготовление дезинфицирующих растворов различной концентрации Практические работы по географии для 6 класса Организация работы процедурного кабинета Изменения в неживой природе осенью Уборка процедурного кабинета Сольфеджио. Все правила по сольфеджио Балочные системы. Определение реакций опор и моментов защемления |
Fig. 1 - 17. Scheme of connection the single wiring operator stations to the level of controlСодержание книги
Поиск на нашем сайте
There is another option. Often operator stations are connected to a server or a redundant pair of servers. Servers in turn are connected to industrial controllers. Thus, the server, as a kind of buffer, continuously reads data from the controller and provides them on demand to workstations. Stations connected to such a scheme, often referred to as clients (see Fig. 1 - 17).
Рис. 1.14. Клієнт-серверна архітектура операторського рівня Fig. 1 - 17. Client-server architecture of operator level
How is information exchanged? To pair the operator's station with an industrial controller on the first install special software, called I / O driver. Driver I / O support is compatible with the controller communication protocol, and allows applications to read from the controller parameters, or vice versa record them in it. Package visualization refers to I / O driver every time you want to update the information displayed or modified by the operator data entry. To visualize the interaction of the package and I / O drivers using multiple protocols, the most popular of which - OPC (OLE for Process Control) and NetDDE (Network Dynamic Data Exchange). In summary we can say that the OPC and NetDDE - is a protocol for information exchange between different applications that can run on one, and on different computers. Figures 1 - 18 and 1 - 19 shown as interacting software components with different schemes for constructing carrier-grade.
Рис. 1.15. Схема взаємодії програмних модулів при використанні поодиноких станцій Fig. 1 - 18. Scheme of interaction of program modules using single station
Рис. 1.16. Схема взаємодії програмних модулів при використанні клієнт-серверної архітектури Fig. 1 - 19. Scheme of interaction of program modules using a client-server architectures
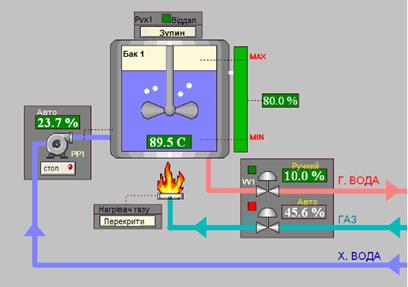
How does SCADA look like? Let us consider a simple example. Fig. 1 - 20 shows a very simplified version of the operator pneumoscheme for control process. As seen,
Рис. 1.17. Приклад операторської мнемосхеми Fig. 1 - 20. Example of operator pneumoscheme
the reservoir (capacity)is filled with water. The system purpose is to heat this water up to a certain temperature. For water-heating gas burner is used. The intensity of the combustion is controlled by the gas flow valve. Also there should be a pump for pumping water into the reservoir and valve to drain the water. The pneumoscheme shows the main technological parameters, such as: water temperature, water level in the reservoir, the work of pumps, valves, etc. These data are updated on the screen with a given frequency. If any parameter reaches the value of emergency, the appropriate field starts to flash, attracting the attention of the operator. I / O signals and actuators are displayed on the pneumoschemes in the form of interactive graphic symbols (icons). Each type of signals and actuators is assigned by its own symbol: for a discrete signal that can be a switch, button or bulb is used, for analog - the slider, chart or text box for the motors and pumps - the more complex faceplates (faceplates). Each character usually represents a separate ActiveX component. In general, ActiveX technology is widely used in SCADA-packages, as it allows the developer to load additional characters not included in the standard library, as well as develop their own graphic elements, using high-level programming languages. For example, the operator wants to include a pump. For this, he / she clicks on the icon and causes the control panel (faceplate). On this panel, he can perform certain manipulations: enable or disable the pump, confirm the warning system, to translate it into mode "maintenance", etc. (see Fig. 1 - 21).
Рис. 1.18. Приклад фейсплейта для управління насосом Fig. 1 - 21. An example of faceplate for pump control The operator can also see a graph of technological parameter change he is interested in, for example, over the past week. To do this he must call the trend (trend) and select the appropriate option to display. Example of trend of real time is shown in Fig. 1 - 22.
Рис. 1.19. Приклад відображення двох параметрів
|
|||||
|
|
Последнее изменение этой страницы: 2016-06-29; просмотров: 408; Нарушение авторского права страницы; Мы поможем в написании вашей работы! infopedia.su Все материалы представленные на сайте исключительно с целью ознакомления читателями и не преследуют коммерческих целей или нарушение авторских прав. Обратная связь - 3.17.165.240 (0.01 с.) |