Заглавная страница Избранные статьи Случайная статья Познавательные статьи Новые добавления Обратная связь FAQ Написать работу КАТЕГОРИИ: ТОП 10 на сайте Приготовление дезинфицирующих растворов различной концентрацииТехника нижней прямой подачи мяча. Франко-прусская война (причины и последствия) Организация работы процедурного кабинета Смысловое и механическое запоминание, их место и роль в усвоении знаний Коммуникативные барьеры и пути их преодоления Обработка изделий медицинского назначения многократного применения Образцы текста публицистического стиля Четыре типа изменения баланса Задачи с ответами для Всероссийской олимпиады по праву 
Мы поможем в написании ваших работ! ЗНАЕТЕ ЛИ ВЫ?
Влияние общества на человека
Приготовление дезинфицирующих растворов различной концентрации Практические работы по географии для 6 класса Организация работы процедурного кабинета Изменения в неживой природе осенью Уборка процедурного кабинета Сольфеджио. Все правила по сольфеджио Балочные системы. Определение реакций опор и моментов защемления |
Time-Series analysis of the relationship between inflation rate and unemployment rateСодержание книги
Поиск на нашем сайте
On the basis of the quantitative data processed, analysis of the results from secondary data provided us important insight information for the sake of realizing the influential impact on unemployment. The findings are discussed along with critical explanation for the stated hypothesis. [14] Figure 3. Descriptive Results of inflation rate and unemployment rate in 2000-2015 years (source: Excel file)
Figure 3 explains the descriptive statistics about inflation, GDP and unemployment. It can be seen that minimum and maximum values of inflation have large gap in the ten years period. The gap indicates that Kazakhstan’s inflation is inconsistent and highly volatile. While the variation and gap between maximum and minimum values can be found comparatively low, but still inconsistent in some years. Kurtosis indicates 3.29 - the peak and tails of a distribution differ from the normal distribution. The mean is the average of the data, which is the sum of all the observations divided by the number of observations. In our example, mean is 7.36875. The median is the midpoint of the data set. This midpoint value is the point at which half the observations are above the value and half the observations are below the value. Our median is 6.95. The mode is the value that occurs most frequently in a set of observations. Minitab also displays how many data points equal the mode. We do not have the most frequent number.
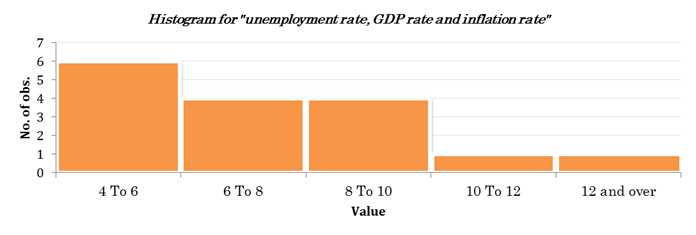
Figure 4. Histogram for “unemployment rate, GDP rate and inflation rate” (Excel file)
Regression analysis To discover the relationship between inflation and unemployment rate, we have used regression. For the purpose of sample, annual data is collected from the economic survey of Kazakhstan and World Bank website for the period of 2000 to 2015. Unemployment is used as dependent variable, whereas Inflation rate and GDP growth rate as independent (explanatory) variable. [15] Based on the theoretical work and empirical literature, we have developed a model to investigate the relationship/impact of macroeconomic variables on the unemployment. UE =β0+β1 INF+ β2 GDP rate +U Where: UE is unemployment of total labor force of a country in percentage β0 representing the coefficient intercept term as constant β1 INF representing inflation (annual percentages of consumer prices) β2 GDP rate representing GDP growth rate U representing the error term of the study The regression analysis is used because it helps to test on the relationship and the significant of relationship of two phenomena the dependent variable and independent variable. The following table tells about statistic of dependent and independent variables. Significance value shows the relationship between dependent and each independent variable. In accordance with Figure 2 it is concluded that unemployment have a significant effect on Inflation. Figure 5. Regression Linear Model between inflation rate and unemployment (source: excel file)
If the β (coefficient) value is positive means that there is positive relationship between independent and dependent variable and the negative value of β means there is negative relationship between independent and dependent variable. It shows there is positive relationship exists between Unemployment, GDP growth rate and Inflation rate. The coefficient of inflation rate (β1), is quite a small positive number. This indicates a positive relationship between unemployment, inflation and GDP growth rates. The equation is:
For a one % increase in inflation rate, unemployment rate increases by approximately 0.228 %. Each additional per cent in GDP growth rate will increase unemployment rate by 0.49 %. Moreover, R- square is 0.59685, it must be conclude, that the explanatory variables “explains” 59.68 % of the variance of unemployment rate. A more exact measure of goodness of fit, which takes into account the number of explanatory variables, is the adjusted R – square. Adjusted R square shows an adequacy of model with 0.53483 that shows independent variables (Inflation and GDP growth rates) can predict 53.48% of variance in dependent variable (Unemployment). [16] The F statistic shows overall effects of independent variable on our target variable. The F – statistic, which tests the overall significance of the sample regression, is 9.62304. Regression model is significant because, because P = 0.00273<0.05.The outcome of simple linear regression verifies the reality of positive relationship between unemployment and inflation. It can be saying easily that Phillips curve does not exist in Kazakhstan. Findings show that inflation and unemployment were much related variables. But there is a positive relationship between them. As we know from the literature of Economics, higher inflation causes lower unemployment and lower inflation causes higher inflation. Thus, findings of this research do not support the same relation. Research Hypothesis Testing the hypothesis: Inflation rate and GDP growth rate considerably influence unemployment rate = 0 H0: β 2 < 0 H1: β 2 ≥0 As it is seen from the hypothesis, we have taken 15 years as the degree of freedom, therefore we have used Student distribution, where T- test value was found as 1.1852. Using α=0.05 level of significant the two tail test t-test with 15 degrees of freedom has critical ± 2.16037. Because t-statistic 1.1852 < 2.16037, then, H0 is accepted, therefore it can be concluded that the first order parameter of the regressive model is insignificant and should not remain in the model. Therefore, according to the hypothesis, inflation rate and GDP growth rate does not have an influence on unemployment rate, because H0 has been accepted. [17]
|
|||||||||||||||||||||||||||||||||||||||||||||||||||||||||||||||||||||||||||||||||||||||||||||||||||||||||||||||||||||||||||||||||||
|
|
Последнее изменение этой страницы: 2016-08-06; просмотров: 678; Нарушение авторского права страницы; Мы поможем в написании вашей работы! infopedia.su Все материалы представленные на сайте исключительно с целью ознакомления читателями и не преследуют коммерческих целей или нарушение авторских прав. Обратная связь - 3.136.19.136 (0.005 с.) |