Заглавная страница Избранные статьи Случайная статья Познавательные статьи Новые добавления Обратная связь FAQ Написать работу КАТЕГОРИИ: ТОП 10 на сайте Приготовление дезинфицирующих растворов различной концентрацииТехника нижней прямой подачи мяча. Франко-прусская война (причины и последствия) Организация работы процедурного кабинета Смысловое и механическое запоминание, их место и роль в усвоении знаний Коммуникативные барьеры и пути их преодоления Обработка изделий медицинского назначения многократного применения Образцы текста публицистического стиля Четыре типа изменения баланса Задачи с ответами для Всероссийской олимпиады по праву 
Мы поможем в написании ваших работ! ЗНАЕТЕ ЛИ ВЫ?
Влияние общества на человека
Приготовление дезинфицирующих растворов различной концентрации Практические работы по географии для 6 класса Организация работы процедурного кабинета Изменения в неживой природе осенью Уборка процедурного кабинета Сольфеджио. Все правила по сольфеджио Балочные системы. Определение реакций опор и моментов защемления |
Competition and Buying PatternsСодержание книги
Поиск на нашем сайте
Pricing of projects and billing rates are surprisingly variable. In consulting at this level, it is easier to be priced too low than too high. Clients and potential clients expect to pay substantial fees for the best quality professional advice. The nature of the billing, however, is sensitive. Clients are much more likely to be offended when a job starts at $20K and ends up at $30K because of overruns, than if the same job started at $30K or even $35K.
Clients rarely compare consultants directly, looking for two, or more, possible providers of a proposed project or job. Usually they follow word-of-mouth recommendations and either go for the job or not, rather than selecting from a menu of possible providers.
The most important element of general competition, by far, is what it takes to keep clients for repeat business. It is worth making huge concessions in any single project to maintain a client relationship that brings the client back for future projects.
Main Competitors
Ferguson Simek Clark (FSC Group): This well established architectural and multi-discipline engineering firm would be our main competitor. This firm has branch offices in Iqaluit, NT and Whitehorse, YT besides a head office located in Yellowknife, NT. Their principal strength is undertaking a project from inception through to completion under one roof. Their weakness stems from an understaffed structural engineering group. At present, there is only one structural engineer who services the needs of all their in-house architects and outside clients. The drafting aspects of any project rely upon recollection and modification of past projects typically. There is no systematic manner in which standard block libraries are maintained or updated. They underutilize the programs at their disposal for structural analysis and design. A.D. Williams Engineering Ltd. (ADWEL): This multi-discipline engineering firm is well established in Yellowknife. Their head office is located in Edmonton, Alberta. They can draw on additional resources from the core group as required to meet the demands of project schedules. At present, there is no resident structural engineer on staff in Yellowknife. Girvan and Associates: This is a small one person architectural and engineering firm which specializes in providing services for residential construction projects. Ian Girvan services the private sector mostly. It is our hope that we can form a strategic alliance to carry out consulting work jointly as needs and occasions arise.
Strategy and Implementation Summary
Strategy and Implementation Summary
StructureAll Ltd. will focus on the Western Arctic area initially. We believe the creation of Nunavut will still provide opportunities for structural engineering services; however a separate Association of Professional Engineers for Nunavut is anticipated. We are also licensed to practice in the Yukon Territories, although we have not planned for any aggressive marketing in this area. The target client is usually an Architect Manager.
Competitive Edge
StructureAll Ltd. offers the following competitive edge: State-of-the-art modeling, design, analysis, and drafting capabilities. Quality control and assurance program. An Internet website (http:\\www.structureall.com, and e-mail, info@structureall.com).
Marketing Strategy
The sections which follow describe in more detail our positioning statement, pricing, and promotion strategy.
Positioning Statement
For established engineering and architectural firms in Yellowknife who require structural engineering sub-consultant services, StructureAll Ltd. offers a competitive and economical option. Projects may be delegated to StructureAll Ltd. directly or arrangements can be made to supplement and assist their own in-house staff.
Pricing Strategy
Most consulting work is billed on an hourly basis to pre-determined levels dictated by project schedule milestones. We have assigned a rate of $80/hour for basic consulting services and $40/hour for drafting services. These are conservative values for the consulting market. We have used conservative unit rates to remain more competitive.
Promotion Strategy
We will be using the Internet extensively in our sales promotion. Together with a well targeted direct mail and e-mail campaign, we will make all the major players in the marketplace aware of our presence. We will focus our limited advertising budgets to promote community sponsored events. We will also offer technical services at discount rates to non-profit organizations. When travelling to remote communities, we will contact the local principals in elementary and high schools offering them a speaker on structural engineering as a career choice. StructureAll Ltd. will apply for the Northwest Territories Business Incentive Policy. This policy is directed at those firms resident in the Northwest Territories and provides incentives with respect to evaluation of services.
Sales Strategy
Success in a consulting market is focused on client service and typically translates into repeat business. We will avoid the pitfall of buying a project, only to find the scope of work far exceeds renumeration. When a potential client questions the cost of a project, we explain the benefits and refer to our proposal which clearly outlines the tasks to be performed. If the budget is for less money, then we must offer less service. Billing rates are not negotiated. One exception to this rule would be for not-for-profit organizations where marketing can be traded for services in kind.
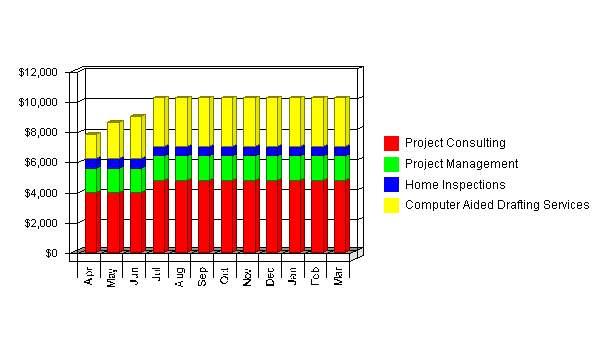
Sales Forecast
The following table and chart summarizes forecasted sales. We expect sales to remain at a constant level after three months of operation. We predict the first two months of operations will be slow. Revenues will be limited while a generic quality management plan is formulated and basic office administration tasks are completed. Direct unit costs for the first year have been set at 30% of unit revenues, which yields a 70% gross margin. In the third year of operations, we plan to increase gross margin to 80% as a result of providing a more efficient service to our clients. Our unit rate for basic consulting services has been set at $80/hour. This is a conservative assumption based on published salary guideline levels for engineering professionals. Our unit rate for CADD services is $40/hr.
Sales Forecast
Sales
Sales Monthly
Milestones
The accompanying table lists important program milestones, with dates and managers in charge, and budgets for each. The milestone schedule indicates our emphasis on planning for implementation.
What the table doesn't show is the commitment behind it. Our business plan includes complete provisions for plan-vs.-actual analysis, which will be updated monthly to compare the variance and plan for course corrections.
Milestones
Management Summary
Management Summary
StructureAll Ltd. will initially have one employee who is also acting as general manager. Phil Nolan will be responsible for all daily operations in the firm.
Management Team
Philip Nolan, P. Eng. has eighteen years of progressive and responsible engineering experience. Phil will be responsible for soliciting clients, marketing, promotion, and all daily aspects of running the business. He graduated from McGill University in Montreal, Quebec in 1981 with a Bachelor of Engineering degree. Following graduation in 1981, Phil worked for consulting engineers in Toronto, Ontario on a variety of transportation planning projects. In 1982, Phil moved to Yellowknife where he worked for the GNWT as a Project Engineer. Phil gained experience working on a host of community development and transportation related projects, including Little Buffalo River Bridge, Bridge Inspections, and Bridge Rehabilitations. Phil was with the GNWT for six years. From 1988 to 1991, Phil worked for Foundation Co. of Canada Ltd., a large multi-national contracting firm as a project engineer where he gained experience in the use of explosives at the Magpie River Hydro Development and continued gaining experience on several bridge projects. In 1992, Phil worked for Reid Crowther & Partners Ltd. out of Edmonton, Alberta on a host of bridge design and rehabilitation projects, including the Whitemud Ravine Pedestrian Bridges. From 1993 to 1995, Phil was self employed as a private consultant offering services in quality control and assurance for building construction where he gained considerable experience in Preserved Wood Foundations and their use in residential and commercial applications. In May of 1995, Phil joined the Ferguson Simek Clark (FSC) team of professionals and was responsible for all structural design, including quality control and assurance services for schools, arenas, health centres, and other buildings. Phil will be the principal designer of all projects at StructureAll Ltd. Phil is currently working on a contract basis for Ferguson Simek Clark.
Management Team Gaps
StructureAll Ltd. will require administrative support to ensure clients are billed on a timely basis. We will be looking to an outside source for ensuring the books are kept in order and up to date. Self sufficiency in computer aided drafting capabilities will require Phil to become more familiar with AutoCADD 2000 as a drafting tool. We will invest in continuing education to fulfill this need. We have accounted for this in the business plan.
Personnel Plan
The following table summarizes our personnel expenditures for the first three years, with compensation increasing from $50K the first year to $70K in the third. The detailed monthly personnel plan for the first year is included in the appendices.
Financial Plan
Financial Plan
The financial plan which follows summarizes information regarding the following items: Important Assumptions. Key Financial Indicators. Break-Even Analysis. Projected Profit and Loss. Projected Cash Flow. Projected Balance Sheet. Business Ratios.
Important Assumptions
The financial plan depends on important assumptions, most of which are shown in the following table as annual assumptions. The monthly assumptions are included in the appendices. Some of the more important underlying assumptions are: We assume a strong economy, without major recession. We assume the creation of Nunavut will not dramatically change the delivery of engineering services. Interest rates, tax rates, and personnel burdens are based on conservative assumptions.
Key Financial Indicators
The following benchmark chart indicates our key financial indicators for the first three years. We foresee modest growth in sales and a marginal reduction in operating expenses for the years presented.
Benchmarks
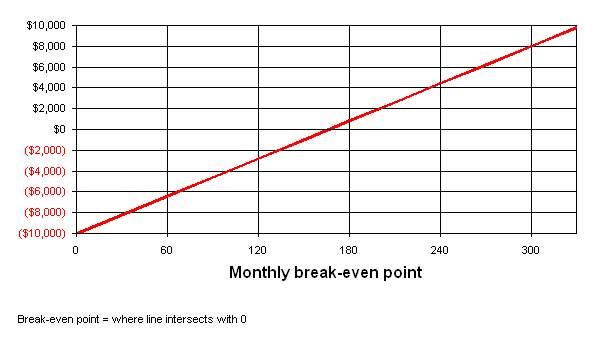
Break-even Analysis
The following table and chart summarize our break-even analysis. With estimated monthly fixed costs of $6,500, billing targets of $10,000 per month will cover our costs. We don't really expect to reach break-even until a few months into the business operation.
The break-even assumes unit variable costs at 30 percent of unit revenue. The unit revenue value of $60/hour is an aggregate measure for all the types of services which will be offered.
Break-even Analysis
Break-even Analysis:
Monthly Units Break-even 167 Monthly Revenue Break-even $10,000
Assumptions: Average Per-Unit Revenue $60.00 Average Per-Unit Variable Cost $0.00 Estimated Monthly Fixed Cost $10,000
Projected Profit and Loss
The gross margin for a service-based business is a reflection of the efficiency at which those services are offered. In the initial year of operations, we have targeted a gross margin of 70%. This is not an unreasonable figure for a consulting business. For the second and third year of operations, we have targeted gross margins of 75% and 80% to indicate overall improved efficiency at service delivery. Net Profit/Sales is determined to be 7.8% the first year, increasing to 9.8% the second year and 11.0% the third year. In order to fulfill the requirements of the mission statement and simultaneously reduce start up costs, we have made arrangements to purchase software on quarterly repayment options: Staad-Pro Core is a structural engineering design and drafting suite offered through Research Engineers Ltd. This program fulfills the need to carry out three-dimensional analysis and design requirements and is a key feature of the business plan. This program supports Canadian codes and standards. We have contacted the authorized Canadian reseller (Detech Corporation Ltd.) and will made arrangements to purchase this tool on four payments of $1,550 over the first year of operations. Errors and Omissions Insurance is required for all consultants working on behalf of the Territorial Governments. Through Falconair Insurance, we have received a quotation of $1,200/year for this coverage. The first year's premium payments are included in the start-up costs, with subsequent years indicated at the same annual premium. Website hosting fees are included as quarterly payments to Internic.com, the Web host. As part of this service, we will have at our disposal file transfer protocol capabilities. This feature permits us to place electronic media on the Internet for our clients and strategic allies.
Projected Cash Flow
Cash flow projections are critical to our success. The monthly cash flow is shown in the illustration, with one bar representing the cash flow per month, and the other the monthly balance. The first few months are critical. It may be necessary to inject additional capital in this time-frame if the need arises. The annual cash flow figures are included here and the more important detailed monthly numbers are included in the appendices.
Cash
Projected Balance Sheet
The balance sheet in the following table shows managed but sufficient growth of net worth and a sufficiently healthy financial position. The monthly estimates are included in the appendices.
Pro Forma Balance Sheet
Assets Current Assets FY 2000 FY 2001 FY 2002 Cash $45,707 $105,178 $173,733 Accounts Receivable $15,019 $16,540 $17,612 Other Current Assets $0 $0 $0 Total Current Assets $60,726 $121,718 $191,345
Long-term Assets Long-term Assets $0 $0 $0 Accumulated Depreciation $1,800 $3,600 $5,400 Total Long-term Assets ($1,800) ($3,600) ($5,400) Total Assets $58,926 $118,118 $185,945
Liabilities and Capital Current Liabilities FY 2000 FY 2001 FY 2002 Accounts Payable $3,677 $3,575 $3,314 Current Borrowing $0 $0 $0 Other Current Liabilities $0 $0 $0 Subtotal Current Liabilities $3,677 $3,575 $3,314
Long-term Liabilities $3,300 $6,600 $10,000 Total Liabilities $6,977 $10,175 $13,314
Paid-in Capital $20,000 $20,000 $20,000 Retained Earnings ($13,000) $31,949 $87,942 Earnings $44,949 $55,994 $64,689 Total Capital $51,949 $107,942 $172,631 Total Liabilities and Capital $58,926 $118,118 $185,945 Net Worth $51,949 $107,942 $172,631
Business Ratios
Business ratios for the years of this plan are shown below. Industry profile ratios based on the Standard Industrial Classification (SIC) code 8711, Engineering Services, are shown for comparison.
Ratio Analysis FY 2000 FY 2001 FY 2002 Industry Profile Sales Growth 0.00% 10.13% 6.48% 7.10%
Percent of Total Assets Accounts Receivable 25.49% 14.00% 9.47% 35.40% Inventory 0.00% 0.00% 0.00% 3.70% Other Current Assets 0.00% 0.00% 0.00% 38.30% Total Current Assets 103.05% 103.05% 102.90% 77.40% Long-term Assets -3.05% -3.05% -2.90% 22.60% Total Assets 100.00% 100.00% 100.00% 100.00%
Current Liabilities 6.24% 3.03% 1.78% 44.50% Long-term Liabilities 5.60% 5.59% 5.38% 11.70% Total Liabilities 11.84% 8.61% 7.16% 56.20% Net Worth 88.16% 91.39% 92.84% 43.80%
Percent of Sales Sales 100.00% 100.00% 100.00% 100.00% Gross Margin 70.00% 75.00% 80.00% 0.00% Selling, General & Administrative Expenses 62.22% 65.24% 69.07% 81.80% Advertising Expenses 0.51% 0.58% 0.54% 0.20% Profit Before Interest and Taxes 45.42% 51.21% 56.57% 2.50%
Main Ratios Current 16.51 34.04 57.74 1.69 Quick 16.51 34.04 57.74 1.37 Total Debt to Total Assets 11.84% 8.61% 7.16% 56.20% Pre-tax Return on Net Worth 102.54% 61.03% 44.74% 6.00% Pre-tax Return on Assets 90.40% 55.77% 41.54% 13.60%
Additional Ratios FY 2000 FY 2001 FY 2002 Net Profit Margin 38.20% 43.21% 46.88 Return on Equity 86.53% 51.87% 37.47%
Activity Ratios Accounts Receivable Turnover 7.84 7.84 7.84 Collection Days 43 44 45 Inventory Turnover 0.00 0.00 0.00 Accounts Payable Turnover 17.75 18.54 20.04 Payment Days 21 20 19 Total Asset Turnover 2.00 1.10 0.74
Debt Ratios Debt to Net Worth 0.13 0.09 0.08 Current Liab. to Liab. 0.53 0.35 0.25
Liquidity Ratios FY 2000 FY 2001 FY 2002 Net Working Capital $57,049 $118,142 $188,031 Interest Coverage 299.00 134.08 94.06
Additional Ratios Assets to Sales 0.50 0.91 1.35 Current Debt/Total Assets 6% 3% 2% Acid Test 12.43 29.42 52.43 Sales/Net Worth 2.27 1.20 0.80 Dividend Payout 0.00 0.00 0.00
Note
Remember always
Executive Summary: Write this last. It’s just a page or two of highlights. Company Description: Legal establishment, history, start-up plans, etc. Product or Service: Describe what you’re selling. Focus on customer benefits. Market Analysis: You need to know your market, customer needs, where they are, how to reach them, etc. Strategy and Implementation: Be specific. Include management responsibilities with dates and budgets. Make sure you can track results. Web Plan Summary: For e-commerce, include discussion of website, development costs, operations, sales and marketing strategies. Management Team: Describe the organization and the key management team members. Financial Analysis: Make sure to include at the very least your projected Profit and Loss and Cash Flow tables.
|
|||||||||||||||||||||||||||||||||||||||||||||||||||||||||||||||||||||||||||||||||||||||||||||||||||||||||||||||||||||||||||||||||||||||||||||||||||||||||||||||||||||||||||||||||||||||||||||||||||||||||||||||||||||||||||||||||||||||||||||||||||||||||||||||||||||||||||||||||||||||||||||||||||||||||||||||||||||||||||||||||||||||||||||||||||||||||||||||||||||||||||||||||||||||||||||||||||||||||||||||||||||||||||||
|
|
Последнее изменение этой страницы: 2017-02-08; просмотров: 546; Нарушение авторского права страницы; Мы поможем в написании вашей работы! infopedia.su Все материалы представленные на сайте исключительно с целью ознакомления читателями и не преследуют коммерческих целей или нарушение авторских прав. Обратная связь - 216.73.216.102 (0.008 с.) |