Заглавная страница Избранные статьи Случайная статья Познавательные статьи Новые добавления Обратная связь FAQ Написать работу КАТЕГОРИИ: ТОП 10 на сайте Приготовление дезинфицирующих растворов различной концентрацииТехника нижней прямой подачи мяча. Франко-прусская война (причины и последствия) Организация работы процедурного кабинета Смысловое и механическое запоминание, их место и роль в усвоении знаний Коммуникативные барьеры и пути их преодоления Обработка изделий медицинского назначения многократного применения Образцы текста публицистического стиля Четыре типа изменения баланса Задачи с ответами для Всероссийской олимпиады по праву 
Мы поможем в написании ваших работ! ЗНАЕТЕ ЛИ ВЫ?
Влияние общества на человека
Приготовление дезинфицирующих растворов различной концентрации Практические работы по географии для 6 класса Организация работы процедурного кабинета Изменения в неживой природе осенью Уборка процедурного кабинета Сольфеджио. Все правила по сольфеджио Балочные системы. Определение реакций опор и моментов защемления |
Topic: Anthropogenic factor. Ecological crisis Global climate change: Global warmingСодержание книги
Поиск на нашем сайте
Topic: Anthropogenic factor. Ecological crisis Global climate change: Global warming Objectives: 1. Characteristics of anthropogenic factor 2. Environment and its components 3. Ecological crisis and ecological situations 4. Modern Ecological crisis: Pollution. 5. Natural gas composition of the atmosphere. 6. Global energy balance and Greenhouse effect. Greenhouse gases 7. Global warming, its sources and solving the problem of sustainably. International cooperation on climate change problem
1. Characteristics of anthropogenic factor Anthropogenic factor – is that caused by human activities. Characteristics: - Irregular and therefore unpredicted effect on organisms at a higher rate - organisms cannot adopt. - Unlimited effect on organisms up to utter destruction: (compare with natural disasters!). - Effect on organisms through changes of environment (temperature, moisture, light, climate, pollutants etc.). - Negative effect of people's activity for themselves (as species) and for other organisms ("Ecological boomerang" principle). - Creation of social factors (TV, stress, education, living conditions etc.) that affect people as well as natural factors.
Scheme: An overview of the ecological issues
ENVIRONMENT |

 Lithosphere (energy, materials)
 Hydrosphere (water)
 Biosphere (wildlife)


2. Environment and its components
"First nature", or Ecological space - natural environment, weakly changed by human -occupies 1/3 earth land. Mostly they are less suitable for people living: high mountains regions, glaciers, north marsh areas etc.). This environment can be regenerated and regulated itself. Most of the areas are also presented with Rain forests. But nowadays they are restricted at large scales.
Lecture 10
Topic: Stratosphere Ozone Depletion. Acid Rains.
Section objectives:
1. The nature of ozone and mechanism of ozone layer work
2. Ozone depletion: history, sources and the effects of ozone layer destruction
3. Air pollution: wet and dry smog, indoor air pollution.
4. The nature, sources & the effects of acid rain
5. Sustainable strategies on ozone depletion & acid rain problems. International cooperation
1. The nature of ozone and mechanism of ozone layer work
troposphere ~ 8-15 km
stratosphere ~ 50-60 km
mesosphere ~ 95-120 km
thermosphere ~ 600 km
Ozone gas (O3) - is a form of oxygen, which is present in the atmosphere.
Ozone exists at two levels. At ground level, it is poisonous to life (Tropospheric ozone). In the stratosphere, it exists as a layer 15 to 55 km above the earth, where it forms an important barrier against harmful ultra-violet (UV) rays from the sun (Stratospheric ozone).
The ozone layer is a renewable form of protection that converts harmful UV radiation into heat. UV includes: UV-A (320 – 400 nm); UV-B (280 – 320 nm; UV-C (220 – 280 nm). Ozone layer filters out all the sun’s ultraviolet in the range of 220 nm – 290 nmOzone also helps to control the temperature of the outer stratosphere.
How to measure Ozone? The atmospheric ozone columnar density above a point on the earth's surface is measured in Dobson units (DU) One Dobson unit refers to a layer of ozone that would be 10 µm thick under standard temperature and pressure. For example, 300 DU of ozone brought down to the surface of the Earth at 0 °C would occupy a layer only 3 mm thick. One DU is 2.69×10²⁰ ozone molecules per square meter.
|
|
A baseline value of 220 DU is chosen as the starting point for an ozone hole since total ozone values of less than 220 Dobson Units were not found in the historic observations over Antarctica prior to 1979. The Dobson unit is named after Gordon Dobson, who in the 1920s built the first instrument to measure total ozone from the ground.
2. Ozone depletion: history, sources & the effects of ozone layer destruction
In the upper atmosphere ozone is regularly created and destroyed naturally. The activity of the sun causes variations in the Ozone layer throughout the year.
The Chapman Reactions
| O2 + hv | ® | O + O | (1) |
| O + O2 | ® | O3 | (2) |
| O3 + hv | ® | O2 + O | (3) |
| O + O3 | ® | O2 + O2 | (4) |
Reaction (2) becomes slower with increasing altitude while reaction (3) becomes faster. The concentration of ozone is a balance between these competing reactions. In the upper atmosphere, atomic oxygen dominates where UV levels are high. Moving down through the stratosphere, the air gets denser, UV absorption increases and ozone levels peak at roughly 20km. As we move closer to the ground, UV levels decrease and ozone levels decrease. The layer of ozone formed in the stratosphere by these reactions is sometimes called the 'Chapman layer'.
However, certain artificial chemical gases also destroy ozone. Although these gases are harmless to humans, they drift up to the stratosphere, where they form the compounds that destroy ozone.
CFCs (Chlorofluorocarbons) are most important of these gases, in term of quantity and impact. There is no natural way to remove them once they are in the atmosphere. Not only do they contribute to ozone destruction, but they are also one of the main greenhouse gases (See the topic: "Greenhouse effect").
History: Scientists have been measuring the concentration of ozone over the Antarctic since 1957. They have noticed it thinning significantl)- in the last 10 to 15. years. Dramatic loss of ozone in the lower stratosphere over Antarctica was first noticed in the 1970s by a research group from the British Antarctic Survey (BAS) who were monitoring the atmosphere above Antarctica from a research station.
In 1982 they discovered an unexpectedly large fall in concentration, and an expedition in 1987 found an ozone "hole" the size of the USA and deeper than the height of Mount Everest. A similar hole has now been detected in the Arctic. In 1991 it was found that ozone was being destroyed tuice as fast as had been expected.
Loss of ozone has serious environmental effects. Sunlight supplies the energy for life on earth, but it also contains UV radiation (especially UV-B), which causes living tissue to decompose. Ozone absorbs UV light, so destruction of the ozone layer allows much more radiation from the sun to reach the earth's surface than normal.
Two primary threats on ozone layer:
- release of CFC
- jet travel in the stratosphere (nitric oxide, NO)
Industries can contribute to ozone depletion if:
They manufacture chemicals that damage ozone: CFCs and HCFCs, methyl chloroform, carbon tetrachloride or halons.
They use CFCs or HCFCs:
- in freezers, air conditioners and cooling systems. These chemicals are released only after these products have been disposed of.
- as solvents to clean and degrease products such as electronic circuit boards.
- as propellants in aerosol cans such as spray-on glue.
- to make synthetic foam and packaging.
They use methyl chloroform for metal cleaning, in adhesives or for electronic cleaning.
They use carbon tetrachloride in any chemical process.
They use fire extinguishers that contain halons.
Sources of acid rain.
Industries can contribute to acid rain if:
- They burn fossil fuels: for ex, the oil and coal that industries use for energy and heating contributes about 17% of the UK’s sulfur dioxide air emissions.
|
|
- They use motor vehicles for goods transportation or other business: the exhaust fumes from motor vehicles produce 45% of the UK’s NOx air emissions and 30% of its are hydrocarbons.
- They use electricity from power stations, which use fossil fuels; 65% of SO2 emissions come from power stations.
- They have older style technology: much of this uses fuels with high sulfur and nitrogen contents and does not control emissions as well as newer equipment.
Effects of acid rains
Ecological consequences of acid rain:
- Acid rain damages and kills trees, fish and other wildlife.
- It also affects human health. Aluminum (Al3+) in natural waters can cause Alzheimer disease – loss of short-term memory.
- Acidity is not always the direct cause of damage. Acid rain can change soil and water. It dissolves nutrients and toxic heavy metals in the soil, and these are then washed into water of rivers and lakes. As a result of this, the soil lacks nutrients and toxic heavy metals in the soil.
It can no longer continue to support trees; freshwater plant and animal life is very often sensitive to the presence of heavy metals.
- Acid rain corrodes also building stone (limestone and marble), fabrics, and metallic constructions.
5. Sustainable strategies on ozone layer & acid rain problems. International cooperation
Industries can help to prevent further damage to the ozone layer:
Population Characteristics
Demographic transition – theprocesswhereby a country moves from relatively high birth and death rates to relatively low birth and death rates due to improved living conditions, that usually accompanies economic development.
Stage 1 – Preindustrial: high birth and death rates, so population grows very slowly.
Stage 2 – Transitional – high birth rate and lowered death rate, so population grows very rapidly.
Stage 3 – Industrial – a decline in birth rate and low death rate, so slow population growth occurs. In developed countries low fertility rate is due to high female literacy.
Stage 4 – Postindustrial – a population grows very slowly or not at all.
Population pyramids - is the age structure that is illustrated as a pyramid with the length of each tier showing the number of males (left side) and number of females (right side) in a particular age group of individuals: Prereproducti\e Reproductive and Postreprodictive. Because of age structure, a population that reduces its fertility rate to the replacement level (2.1 children) will continue to grow for another 30 to 50 >ears. This phenomenon, called population momentum, occurs because of the large number of prereproductive individuals that exist in the population.
Age group of individuals:
- Pre-reproductive (0–14 years)
- Reproductive (15–44 years)
- Post-reproductive (45 years and older)
Age structure pyramid
These population pyramids, showing distribution of population bv age. indicate that Country B has a much greater growth potential than Country A has stable growing
Replacement level = 2.1 children
2. Population growth. Limits to Growth.
Perspectives
• Overpopulation causes resource depletion and environmental degradation
• Human ingenuity and technology will allow us to overcome any problems - more people may be beneficial
Resources are sufficient to meet everyone's needs - shortages are the result of greed, waste, and oppression:
There is a sufficiency in the world for man's need, but not for man's greed.
~Mohandas Gandhi~
For most populations, limiting factors recognized as components of environmental resistance can be placed into 4 main categories:
– Raw material availability
– Energy availability
– Accumulation of waste products
– Interactions among organisms
World is divided into 2 segments based on economic development:
– More-developed countries - 1.4 bln: per capita income > $10,000.
• Europe, Canada, US, Japan, Australia, New Zealand.
• Stable populations.
• Expected to grow 3% by 2050.
– Less-developed countries - 5.53 bln: per capita income < $5,000.
• High population growth rates. Will grow 52% by 2050 (86% of world population).
Ecological footprint – is a measure of land area required to provide human food, energy, water, housing, transportation & waste disposal for one person.
To be ecologically sustainable, each person should consume no more than 1.8 ha of land (ecological footprint).
Data in table is given as global hectares per capita. The world-average ecological footprint in 2007 was 2.7 global hectares per person (18.0 billion in total). With a world-average biocapacity of 1.8 global hectares per person (12 billion in total), this leads to an ecological deficit of 0.9 global hectares per person (6 billion in total). If a country does not have enough ecological resources within its own territory, then there is a local ecological deficit and it is called an ecological debtor country. Otherwise, it has an ecological remainder and it is called an ecological creditor country
| Country | Population in millions | Ecological Footprint in gha/pers | Biocapacity in gha/pers | Ecological remainder (if positive) in gha/pers |
 United States United States
| 308.67 | 8.00 | 3.87 | -4.13 |
 Mongolia Mongolia
| 2.61 | 5.53 | 15.14 | 9.61 |
 Saudi Arabia Saudi Arabia
| 24.68 | 5.13 | 0.84 | -4.29 |
 Germany Germany
| 82.34 | 5.08 | 1.92 | -3.16 |
 France France
| 61.71 | 5.01 | 3.00 | -2.01 |
 Italy Italy
| 59.31 | 4.99 | 1.14 | -3.85 |
 UnitedKingdom UnitedKingdom
| 61.13 | 4.89 | 1.34 | -3.55 |
 Japan Japan
| 127.40 | 4.73 | 0.60 | -4.13 |
 Kazakhstan Kazakhstan
| 15.41 | 4.54 | 4.01 | -0.53 |
 Russia Russia
| 141.94 | 4.41 | 5.75 | 1.34 |
 Ukraine Ukraine
| 46.29 | 2.90 | 1.82 | -1.08 |
 China China
| 1336.55 | 2.21 | 0.98 | -1.23 |
 Uzbekistan Uzbekistan
| 26.90 | 1.74 | 0.92 | -0.82 |
 Kyrgyzstan Kyrgyzstan
| 5.35 | 1.25 | 1.34 | 0.09 |
 India India
| 1164.67 | 0.91 | 0.51 | -0.40 |
Biological Factors
|
|
Main factor of population growth rate: # of women with children & # of children each woman has.
T otal fertility rate - # of children a woman has during her lifetime: rate of 2.1 = replacement fertility level;
Zero population growth: birth rate = death rate
Social Factors
Education level of women: If level of education increases, fertility rates fall. Why?
a) Financial independence leads to later marriage.
b) Educated women are more likely use birth control.
In some cultures women desire large families:
Where infant mortality is high, it is traditional to have large families since not all children may survive.
Parents feel secure when there are many children to look after them in old age.
Economic Factors:
In less developed countries, the economic benefits of children are extremely important.
Even young children can be given jobs that contribute to the family economy, such as protecting livestock, gathering firewood, or carrying water.
- In the developed world, large numbers of children are an economic drain.
- They are prevented from working.
- They must be sent to school at great expense.
- They consume large amounts of the family income.
Political Factors
Governments can reward or punish high fertility rates.
European countries are concerned about low birth rates à policies to encourage having more children:
Paid maternity leave & guaranteed job fo a mother.
Childcare facilities.
Child tax deductions.
Most developing countries are concerned about fast population growth à programs to limit growth:
Education of population: family planning, maternal & child health.
Free or low-cost contraceptives.
One-child policy in China
Factors usually included in an analysis of standard of living:
Economic well-being
Health conditions
Social status and mobility
Economic measure of standard of living is average purchasing power per person.
Gross national income (GNI) is an index of purchasing power measuring total goods and services generated by citizens of a country.
Human populations can increase in size only if other plant and animal populations decrease in size
3. Basic demographic processes:
v Births = Natality
v Deaths = Mortality Note: mortality ≠ morbidity!
v Migration
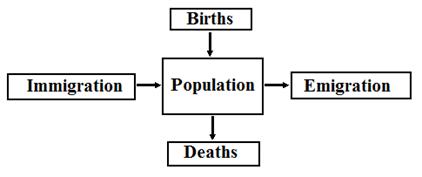
Demographic balancing equation:
Population change = (Births – Deaths) + (Immigrants – Emigrants)
or
∆P = Pt – P0 = (B – D) + (I – E) (1)
where P0 is the initial population and Pt is the population after time t.
Demographic balancing equation (1) can be split into 2 basic components:
Natural increase = Births (B) – Deaths (D)
Net Migration = Immigration (I) – Emigration (E)
Natural increase is the most important component of the overall population change.
Population Growth Rates
Each component of population change (births, deaths, migration) can be expressed as an absolute number (pop change) – crude values or more commonly, as annual rates expressed in %.
Demographic rates are ordinarily calculated per 1000 persons per year.
• Birth Rate = Humans born per 1000 individuals per year.
• Death Rate = Humans died per 1,000 individuals per year.
Since population is changing throughout the year, we use for calculations mid-year population, which is the population in the middle of the particular year.
Crude Birth Rate (СBR) = total number of live births per year per thousand mid-year population.
Crude Death Rate (СDR) = total number of deaths per year per thousand mid-year population.
CBR =  100 0, where # births is number of births during one year,
  is mid-year population. Mid-year population can be calculated as average number between two population values: at the beginning and at the end of the year.
CDR =  1000, where # deaths is number of deaths during one year, is mid-year population.
Crude (Natural) Growth Rate (CGR) = natural (population) growth per year per thousand mid-year population:
CGR = CBR – CDR
This is a natural growth rate. The total growth rate is different, since it includes immigration, emigration.
Crude (Natural) Growth Rate, or just Crude Growth Rate may be also calculated this way:
CGR =  1000, where
  - population change during one year.
Note: CGR as well as other crude rates, may be expressed in %.
|
|
Example 1: suppose that CGR = 15. How many percent was population growth?
It means that natural increase in population is equal to 15 persons per 1000 population per year. To convert it to %, use the following proportion:
15 people à per 1000 population
X people à per 100 population
Solving proportion, find X:
 = 1.5%
You may have noticed that 1.5% can be obtained from 15 by just dividing by 10!
1.5% represents annual rate of population growth.
The average rate of population growth over some extended time period can be calculated if the population size at two points in time is known.
Exponential growth formulas:
Population growth is described by exponential function:
Pt = P0 × (1+r)t (1)
where Po is the initial population, Pt is population at the end of t years, r is annual growth rate expressed as a decimal.
For t = 1 year, that is for annual population growth the formula (1) will look simple:
Pt = P0×(1+r) (2)
Example 2. Annual population growth rate is 6%. Assuming that the initial population of certain country at the beginning of the year was 10 mln, find its population by the end of the year.
P0 = 10 mln r = 0.06 (6%) Pt =?
Using formula (2), we get:
Pt = 10 mln *(1+0.06) = 10.6 mln people
Applying fundamental limit rule to formula(1) at high t values (more accurately, at  ), we get:
 (3)
(3)
where Pt - population in t years from 0 time; P0 - population in time 0;
t represents number of yrs and r is annual rate of growth (decimal).
Formula (3) is convenient for calculations and even at relatively small t gives good approximation.
Population doubling time = the number of years until the population will double if the annual rate of growth remains constant.
Rule of 70 for calculating doubling time: T2 =  , where r is annual growth rate in %.
5. Urban problems in developing & developed countries
In developing contries:
· Dense traffic, smoky factories, use of wood or coal fires cause excessive air pollution.
· Lenient pollution laws, corrupt officials and ignorance cause even more pollution.
· Only 35% of urban residents in developing countries have satisfactory sanitation services.
In developed countries
• The rapid growth of central cities in Europe and North America has now slowed or even reversed.
• The good news is better air and water quality, safer working conditions, fewer communicable diseases.
• The bad news is urban decay and sprawl and transportation issues have worsened
Urban Sprawl - is a Current Developed World Problem
In most American metropolitan areas, the bulk of new housing is in large, tract developments that leapfrog beyond city edges in search of inexpensive land.
Urban sprawl consumes about 200,000 ha of US agricultural land annually.
Planning authorities are often divided among many small local jurisdictions.
Most American cities devote ~1/3 of their land area to cars.
Freeways have reshaped our lives.
Public transportation is expensive and difficult to establish.
6. Ways to achieve urban sustainability
Lecture 12
Topic: Economic aspects of environmental sustainability
The main idea: Follow the simple golden rule for an sustainable economy: “Leave the world better than you found it, take no more than you need, try not to harm life or the environment, and male amends if you do.” (Paul Hawken)
Lecture outline:
1. Economic systems and environmental problems
2. Measures of life and environmental quality
3. Concept of externalities
4. Economic strategies for pollution control
5. Solutions of reducing poverty
6. Sustainable strategies on economy
1. Economic systems and environmental problems
Economic resources:
1) Natural capital (natural resources) – earth’s resources and processes that sustain living organisms, including humans (goods and services produced by the earth’s natural processes).
These include: the planet’s air, water, and land; nutrients and minerals in the soil and deeper in the earth’s crust; wild and domesticated plants and animals (biodiversity); and nature’s dilution, waste disposal, pest control, and recycling services.
2) Manufactured capital – items made from earth capital with the help of human capital.
This includes: tools, machinery, equipment, factory buildings, and transportation and distribution facilities.
3) Human capital – people’s physical and mental talents.
Workers sell their time and talents for wages. Managers take responsibility for combining earth capital, manufactured capital, and human capital to produce economic goods.
Major types of economic systems:
1) Command economic system or centrally planned economy – all economic decisions are made by the government.
2) Market economic system – all economic decisions are made in markets, in which buyers (demanders) and sellers (suppliers) of economic goods freely interact without government or other interference. All buying and selling is based on pure competition.
3) Mixed economic system – fall somewhere between the pure market and pure command systems.
Economic growth and sustainability
Economic growth – an increase in countries’ capacity to provide goods and services for people’s final use (accomplished by means of population growth – more consumers and producers, or more consumption per person, or both).
Sustainability – meeting the needs of today without degrading the environment for future generations.
|
|
Ecologically sustainable development, or Sustainable development – the development that meets the needs of the present generations without compromising the ability of future generations to meet their own needs” (Brundtland Commission 1987).
Topic: Anthropogenic factor. Ecological crisis Global climate change: Global warming
Objectives:
1. Characteristics of anthropogenic factor
2. Environment and its components
3. Ecological crisis and ecological situations
4. Modern Ecological crisis: Pollution.
5. Natural gas composition of the atmosphere.
6. Global energy balance and Greenhouse effect. Greenhouse gases
7. Global warming, its sources and solving the problem of sustainably. International cooperation on climate change problem
1. Characteristics of anthropogenic factor
Anthropogenic factor – is that caused by human activities.
Characteristics:
- Irregular and therefore unpredicted effect on organisms at a higher rate - organisms cannot adopt.
- Unlimited effect on organisms up to utter destruction: (compare with natural disasters!).
- Effect on organisms through changes of environment (temperature, moisture, light, climate, pollutants etc.).
- Negative effect of people's activity for themselves (as species) and for other organisms ("Ecological boomerang" principle).
- Creation of social factors (TV, stress, education, living conditions etc.) that affect people as well as natural factors.
|
| Поделиться: |