Заглавная страница Избранные статьи Случайная статья Познавательные статьи Новые добавления Обратная связь FAQ Написать работу КАТЕГОРИИ: ТОП 10 на сайте Приготовление дезинфицирующих растворов различной концентрацииТехника нижней прямой подачи мяча. Франко-прусская война (причины и последствия) Организация работы процедурного кабинета Смысловое и механическое запоминание, их место и роль в усвоении знаний Коммуникативные барьеры и пути их преодоления Обработка изделий медицинского назначения многократного применения Образцы текста публицистического стиля Четыре типа изменения баланса Задачи с ответами для Всероссийской олимпиады по праву 
Мы поможем в написании ваших работ! ЗНАЕТЕ ЛИ ВЫ?
Влияние общества на человека
Приготовление дезинфицирующих растворов различной концентрации Практические работы по географии для 6 класса Организация работы процедурного кабинета Изменения в неживой природе осенью Уборка процедурного кабинета Сольфеджио. Все правила по сольфеджио Балочные системы. Определение реакций опор и моментов защемления |
Themes and content of lecturesСодержание книги
Поиск на нашем сайте
Bitmap Disadvantages However bitmap images have some drawbacks too. A few common disadvantages of these format are as follows: · The most common and obvious disadvantage of these image format is that they are not upward scalable. You can make a bitmap smaller without to much loss, but you cannot make it larger without loosing quality. If you ever see a bitmap image blown up, you’ll notice it has little individual squares or dots that make up the image. When you see it at its optimal size you don’t notice the individual dots, but if you try to make it bigger, the image become fuzzy, jaggy or pixelated. · Another disadvantage of bitmap images is that they require higher resolutions and anti-aliasing for a smooth appearance. · The bmp file has been created by microsoft and ibm and is therefor very strictly bound to the architecture of the main hardware platform that both companies support. That is all about the Bitmaps. Vector Images Vector images are quite different from the bitmaps. As told earlier the bitmap images are made up of pixels but the vector graphics are not made of pixels, instead mathematical formulas called “lines and curves” form shapes that in turn make up a vector image. In this case the computer therefore does not read a list of coloured dots but it look up at the mathematical formula that creates these shapes. Vector images are the graphical representation of geometrical entities such as circles, rectangles or segments. You can enlarge the vector images as much as you want, you will never see a single pixel. Vector images are represented by mathematical formulae. A few examples are as follows: A rectangle is represented by two dots. A circle by a centre and a radius A curve by several points and an equation The computer processor will translate these mathematical calculations into such an information that a can be interpreted by the graphics card. Vector images are created through the process of drawing with vector illustration programs such as CorelDRAW or Adobe Illustrator. The word “vector” is a synonym for line. Vector images can also be created through the process of conversion from a raster image by using a raster to vector conversion program such as CorelTRACE or EuroVECTOR. The most common vector image you come in contact with every day, is type. The type you are reading on the screen right now is vector based.
File Size of Vector Images We now know that unlike the pixelated bitmap images the vector graphics are made up by the mathematical calculations. Today we will lean how this particular feature of vector images affect the file size of these file formats.
File size of vector images: Vector drawings are usually pretty small files because they only contain data about the Bézier curves that form the drawing. The EPS file format that is often used to store vector drawings includes a bitmap preview image along the Bézier data. The file size of this preview image is usually larger than the actual Bézier data themselves. As we discussed earlier the vector images make it possible to define an image with very little information. This feature of vector graphics makes the file weight quite small. Moreover unlike the bitmap images the quality of vector graphics is not dependent on the screen resolution of the monitor screen of the viewer. They look alike on all screen resolutions.
How scaling is done in vector images: When an illustration (drawing) program sizes a vector image up or down, it simply multiplies the mathematical description of the object by a scaling factor. For example a 1″ square object would need to be multiplied by a factor of 2 in order to double in size. The math is simply recalculated to produce an object twice the size of the original.
Where vector images can be used As we have discussed earlier the vector images are highly salable, therefore they are often used to create logos. A vector logo can be easily scaled down to fit on a business card, or scaled up to fit on a tradeshow display, the side of a van or bus, or larger without losing quality.
Vector images can also have transparent backgrounds, making them easy to place or layer on top of other graphics.
Advantages of Vector images: Vector images have a number of advantages over bitmap images, including: · The most important and obvious plus point of vector images is their power of scalability. If you try to enlarge a bitmap image, your computer can only enlarge the size of the squares making up the image area. That is why bitmap images get jagged as you enlarge them. However on the other hand the vector images remain smooth because your computer merely re-computes the coordinates of the points and adjusts the vector equation constants. · Each set of lines in a vector image represent separate and distinct objects. therefore every object can be re-edited at any time. For example, let’s say you created a vector art file with a circle in the background. You could open the drawing file at any time – even days later – and change the circle to a square. · Another very important reason of using vector images instead of bitmaps is their size. Vector images are much smaller in size than the bitmap image format. If you had a very large picture – such as a poster on your wall – the vector file might only take up a few kilobytes of space on your computer, while the same image in a medium resolution bitmap format might not fit on a CD-ROM! Some disadvantages However there are some disadvantages of these images as well. A few are as follow: · Drawings containing trapping information can only be scaled up to 20 percent larger or smaller. · Thin lines may disappear if a vector drawing is reduced too much. · Small errors in a drawing may become visible as soon as it is enlarged too much. · Another important disadvantage of vector is the time and talent needed to create it. You cannot take a photograph in vector. Vector images are drawn on the computer by a graphic artist using vector editing software such as Adobe Illustrator. · Because of the above mentioned reason the vector graphics are not as cost effective as bitmap images.
Corner points These are points that enable the shape of segments on either side to be unaffected by each other. In other words, the straight or curved segments can be shaped to allow the path to abruptly change direction where the point joins them, as shown below. For this reason, the corner point is perhaps the easiest to work with.
Smooth points As the name suggests, smooth points force the direction or angle of curved segments on either side to align, creating a smooth transition between the two endpoints, as shown below. Smooth point handles can be set to unequal distances from the point they control. This will apply only where a smooth point joins two curved segments. While a smooth point is in use, the point and both handles will be in alignment.
Symmetrical points These types of points force the curved segments on either side to be equal in slope or angle, as shown below. Unlike smooth points, symmetrical point handles can only be positioned equal distances from the points they control.
Each smooth and symmetrical point features two curve handles. One handle controls the shape of the preceding segment, while the other controls the shape of the segment to follow. Curved segment endpoints-the points at the beginning and ends of each path-contain only one curve handle each to control the respective segment. In an effort to enable you to distinguish which point is which, QuarkXPress displays each of the points and their associated handles in different ways. A corner point takes the shape of a triangle, a symmetrical point is square-shaped, and a smooth point takes the shape of a rotated square, or diamond.
Defining Points and Segments While Drawing
As you click-drag to create a new point, several things occur in the background. First, the point at which you first clicked with the mouse defines the new point’s position, and now as you continue to drag, you’re no longer holding the actual point. Instead, you’re now dragging a curve segment handle that can be rotated 360 degrees around the new point position. By releasing the mouse button, you define the curve handle’s position, in turn affecting the shape of the curve segment you just created -and the next one you’re about to create. The process is ongoing until you’ve completed drawing your path. Choosing a different tool from the main Toolbox, such as the Item tool, ends bézier drawing sessions. Practice makes perfect and bézier tools are no exception to this rule. While drawing using bézier tools, you can also specify a specific point type (other than the default) by holding down the modifier keys that are listed below, while defining each point’s position.
Tip : Holding Shift as a modifier key, while defining a new point, will constrain the preceding segment angle to 90-degree increments. Holding Shift, while click-dragging to define a new curve segment’s point, will constrain rotation of its curve handles to 45-degree increments. Selecting and Editing Paths Whether you’ve created your path from scratch using bézier drawing tools or you’ve converted a box, shape, or text to a path, knowing how the points and line shapes can be changed or transformed is another critical area. Once you’ve created your path, editing the existing points or segments can be a complex process if you’re unfamiliar (or even if you are familiar) with commands for manipulation of the various components. To edit a path, you must use either the Item tool or the Content tool while an open or closed path is selected. Tip : To reposition the entire path while it’s being created, hold down the Ctrl/Cmd key and drag the path. Both points and segments can be repositioned to any point on or off your layout page simply by dragging (or using the nudge keys), while the shape of curve segments can be altered by dragging their curve handles. To make the editing process even more important, straight segments can quickly be converted to curves or vice versa. Plus, the conditions of points can be interchanged between corner, smooth, and symmetrical states. Common commands for this type of editing can be found in a number of places. To find them, select Point/Segment Type from the Item menu, which only becomes available while a point or segment is selected. But perhaps the most crucial companion to have around when editing points is the Measurements palette (press F9). The Measurements palette, as shown below, provides quick access to nearly all properties associated with points and segments, including fields for entering exact point or handle page positions, and buttons to set the condition of points and/or segments. The palette itself has been organized into two distinct areas.
The left side of the palette includes the following controls: § X and Y: These two fields display the current vertical and horizontal upper-left page position (relative to your ruler origin) of an invisible bounding box surrounding your selected path. To move the path, simply type in a new value followed by the Enter key. § W and H: These two options set the overall width and height dimensions of your selected path. To change the scale of your path, type in a new value followed by the Enter key. § Angle: This option enables you to perform a rotation of your selected path by entering a degree value followed by the Enter key. Positive values rotate the path counterclockwise, while negative values rotate the path clockwise. The right half of the palette is dedicated to points. The controls are as follows: § XP and YP: These abbreviations represent the vertical and horizontal page position of the selected point (relative to your ruler origin). For precision positioning, type in a new value followed by the [enter] key. § Curve Handle Angle: The boxes labeled with angle symbols represent the angle of the curve handles. The left angle box controls the curve handle affecting the preceding segment, while the right angle box controls the curve handle for the segment to follow. § Curve Handle Position: The two boxes below the point angle boxes enable you to specify the curve handle distance from the point they protrude from. Changing the curve handle positions changes the shape of curve segments. Between these path and point options are five buttons that enable you to change the condition of points or segments. On the top row, three buttons enable you to change the selected point(s) to symmetrical, smooth, and corner points, respectively. Below these, two buttons enable you to change a selected segment from (or to) a curved or straight segment. When you draw a path using any of the bézier drawing tools, the result is always an open path, meaning the first and last points remain unjoined. To join these points and close the path so that it can be filled with an image, text, or color, use the Item tool to select the path, hold down the Alt/Option key, and choose Item > Shape > Bézier Box (fourth symbol from the bottom). If the points are on top of each other (or at least close together), the endpoints will become joined automatically.
Point and Segment Shortcuts
Bézier paths give you exacting measures and a high degree of control and flexibility unafforded to you by other drawing tools. And combining the background information here with a little practical experience on your part should get you started on the road to creativity and control.
Слайдтар: What Exactly is a Bézier? Ұсынылатын әдебиеттер тізімі: 1. Peter A. Koenig, Design Graphics, Drawing Techniques for Design Professionals, Third Edition, Doorling Kindersley, India Pvt. Lt., 2012. 2. http://coreldesigner.wordpress.com/2009/06/01/get-snapping-with-coreldraws-object-snapping-features/#more-597 Бақылау сұрақтары 1. What Exactly is a Bézier? Point and Segment Shortcuts
Lecture №29. Page Layout, Printing, Exporting and Advanced Features 29.1 Using Styles and Templates 29.2 Custom Creation Tools
Purpose: Using Styles and Templates and own creation tools Keywords: ellipse tool,rectangle tool, mart fill tool, polygon tool
As the name implies is a set of CorelDraw tools displayed in the form of icons. Knowing how to use these tools covers the basics of CorelDraw.
PICK TOOL: This is the most important I would say of all the tools in corel tool box. It forms the basic of all CorelDraw functions. The pick tool is use to select object, text or any content on the workspace in order to highlight it before any other application or transformation can be apply to that content. It is also used to move object around, to duplicate object through drag and rightclick drop. It is the default tool selected when you first launch CorelDraw. SHAPE TOOL: This tool is use to create irregular shapes through dragging of nodes. Through it nods can be added or deleted from any shape. It can also be launched by pressing F10 in your keyboard. CROP TOOL: This tool is used to crop objects by simply clicking on the object and dragging to draw a rectangle shape within the object and finally clicking on the draw rectangle to minus the area outside the rectangle. ZOOM TOOL: This is used to zoom in and out of the your workspace. Simply pressing Z on your keyboard will also launch this tool. You can also zoom in to your workspace by pressing F2 and dragging through the area you want to zoom into. And then equally press F3 to zoom out. FREE HAND TOOL: This is used to zoom in and out of the your workspace. Simply pressing Z on your keyboard will also launch this tool. You can also zoom in to your workspace by pressing F2 and dragging through the area you want to zoom into. And then equally press F3 to zoom out. Otherwise liken to pencil tool is used to draw straight and irregular lines. To draw a straight line you simply need to click on the beginning point then make sure you release your hand from your mouse button, then pressing down your control button on your keyboard drag your mouse to the end point you want your line to stop and click again before you release the control button. But to draw irregular lines you simply have to click on your mouse and still holding it down move your mouse around the workspace to draw what you want. In case of error or mistake along your drawing you can go back to the point of the line where you want to start your from again by pressing your shift button on your computer keyboard but make sure you are still holding down your mouse button. SMART FILL TOOL: This is used to apply c olour to objects. It apply colour to objects fill and outline and can also be use to determine the thickness of the outline. RECTANGLE TOOL: This is used to draw rectangle shapes simply by clicking while still holding down the mouse drag on your workspace and release. By pressing the control button down on your key board while dragging will give a perfect shape (A square shape) ELLIPSE TOOL: This is used to draw ellipse shapes like circle or oval shapes. This can be achieved by simply clicking on your workspace while still holding down your mouse button drag to draw your shape and release button when done. But to draw a perfect circle you will have to hold down the control button while dragging.
POLYGON TOOL: This is used to draw shapes with more than four sides. The default sides is five but you can add to the side by increasing the number of sides in the option box in the property bar of your CorelDraw just above the rulers. And also, by using shape tool to drag the nodes between the shape edges you can easily create a star shape. By pressing down your control button when you drag to form your star will give you a perfect star shape. See diagram below...
SHAPE TOOLS This tool is use to draw other types of shapes like the love shape, the cross shape, right angle shape etc. You have to select the shape you want to draw from a drop down list in the property bar. See diagram below...
TEXT TOOL: This is used for typing text on your workspace by simply clicking on any spot in your workspace where you want to start typing from. This will launch a blinking cursor, then you can start typing. This type of typing is called a graphic text. To launch the other type of text known as the paragraph text which create a box kind of a margin where you will have to do all your typing without going out of the specified box area. You simply have to click on the spot where you want to start your typing and drag while still holding down the mouse button to cover the area where you want your texts to be and release button. This will create a sort of dotted box in the space you have specified, All your typing will be within this box. You can change the look of the text by changing it´s character in the character selector drop down menu in the property bar. See diagram below.
TABLE TOOL: This is used to draw a table. You can specify the rows and columns the changing their value in the property bar. INTERACTIVE BLEND TOOL: This is used to blend two objects to each other by simply dragging from one to the other. OUTLINE TOOL: This tool is used to specify the thickness of an outline and to determine it colours. By clicking on the tool you can choose from the drop down options like,”no outline, outline colour, thickness in numbers” etc. FILL TOOL: This tool is used to apply fill to an object or shape in different format like “uniform fill, pattern fill, texture fill” etc. You can get more function out of this tool from the property bar when you have already launched it. INTERACTIVE FILL TOOL: This tool is use to create gradient fill on shapes by simply clicking and dragging along the shape to create a linear gradient which is the default. You can change the gradient type and colour in the property bar. See diagram below...
Ұсынылатын әдебиеттер тізімі: 1. Peter A. Koenig, Design Graphics, Drawing Techniques for Design Professionals, Third Edition, Doorling Kindersley, India Pvt. Lt., 2012. 2. http://www.corel.com/corel/pages/index.jsp?pgid=800382&item=resource&listid=13600110 3. http://www.zicara.com/techbytes/web-design/file-formats-vector-imagescont-2 Бақылау сұрақтары 1. This tool lets you draw ribbon objects and explosion shapes. What is it tool? 2. Outline Tool CorelDraw?
Themes and content of lectures
Lecture 1-2. Introduction to Graphic Communication 1.1. Introduction 1.2 Drawing Instruments Purpose: Today you'll be looking at drawing instruments and the typical accessories used in drawing. On completion of the session, you should be able to: • Identify various types of drawing instruments and their uses. • Classify drawing sheets and the different grades of drawing pencils. • Draw the layout and title block on a drawing sheet. • Use the lettering and dimensioning techniques in common practice. Keywords: Drawing Board, Drawing Sheet, Mini drafter, Sharpener and Emery Paper, Drawing clips, The Borderlines
Introduction A picture is worth saying a thousand words; hence drawings are used to visually communicate ideas, thoughts, and designs. Drawings drawn by an engineer for engineering purposes is Engineering Drawing. Drawing is the Universal Graphical Language of Engineers, spoken, read and written in its own way. Engineers must have perfect drawing skills and excellent working knowledge of engineering concepts. An inaccurate drawing may misguide the workman and ultimately affect the production. Drawing Instruments The Drawing Board The D2 or D3 drawing boards are usually used in polytechnics and engineering colleges. Drawing boards are made of well-seasoned softwood such as Oak or Pine. The standard sizes of drawing boards as per BIS (1444-1977) are given in the table.
The Drawing Sheet The standard sizes of drawing sheets as per BIS (10711-1983) are given in the table. The ratio of the width of a drawing sheet to its length is 1: 2. The drawing sheet should be tough and strong and its fibers should not disintegrate when an eraser is used on its surface.
Minidrafter: A minidrafter is a device with two scales set at right angles to each other. It combines the functions of a T-square, setsquares, scales and a protractor. It can be easily and quickly moved to any location on the drawing sheet without altering the scales. A T-square is mainly used together with setsquares for drawing horizontal lines, angles and perpendicular lines. There are two essential parts of a T-square, namely the stock and the blade. The blade is fitted with ebony or a plastic piece to form the working edge of the T-square. The stock and the blade of a T-square are held together at right angles to each other. T-squares are made of hard quality wood such as teak or mahogany, etc.
The instrument box contains the following instruments and accessories. • Compasses-Large compasses and Bow compasses • Dividers-Plain Dividers and Bow Dividers • An Inking pen • A lead case • A Small Screwdriver The instruments in an instrument box are made of nickel coated steel or brass. The Compasses. A pair of compasses are used to draw circles and arcs. Compasses are used in conjunction with scales (rulers). Large compasses are used to draw circles up to 100 mm diameter. For drawing circles of more than 100 mm diameter, a lengthening bar is used. Bow compasses are used for drawing small circles up to 25 mm diameter. Dividers are used in conjunction with scales. Plain dividers are used to divide straight or curved lines into a prescribed number of equal parts, for transferring dimensions and for setting of distances from a scale to drawings. Bow dividers are used to hold precise distances for dividing or transferring. An inking pen is used to draw straight or curved lines in tracing ink. A lead case is used to store pencil leads. A screwdriver is used to tune the screws in the instruments. Setsquares are used to draw parallel and perpendicular lines. Setsquares are made of transparent celluloid or acrylic and may also contain French curves. A procircle is circular in shape. Its periphery is divided into 0.5° graduations that are used to mark and measure angles. It also has circular holes of different sizes that may be used to draw circles of specific diameter. Scales or rulers are devices with precise graduations marked on their straight edges for precise measurements. Scales are made of celluloid or cardboard. Eight types of scales are used (M1, M2,..,M8) as per BIS 10713 - 1983. Scale of a Drawing. The drawing of an object is usually produced to a definite proportion with respect to the actual size of the object. This ratio is called the "scale of drawing". Drawing to Full scale: When a drawing is produced to a size equal to that of the object, the drawing is said to be drawn to "full scale". Drawing to a reduced scale: When a drawing is produced to a size smaller than that of the object, the drawing is said to be drawn to a "reduced scale". Drawing to an enlarged scale: When a drawing is produced to a size greater than that of the object, the drawing is said to be drawn to an "enlarged scale".
Drawing Pencils are of different grades. The HB pencil is a soft grade used for drawing thick lines, borderlines, lettering and arrowheads. The H pencil is used to draw finishing lines, visible lines and hidden lines. The 2H pencil is a hard grade pencil used for drawing construction lines, dimension lines, centre lines and section lines. Other grades are used for artistic application. An eraser is a good quality rubber that is used to erase unwanted lines, arcs etc., from a drawing. Drawing clips are used to fix the drawing sheet on the drawing board. They are made of nickel- coated steel. Cello tape (Adhesive tape) may also be used in place of clips to fix the drawing sheet on the board. Sharpener and Emery Paper. A pencil sharpener is used to give pencils with good drawing tips. Emery paper (120 grade) is used to obtain a conical or chisel tipped pencil. French curves are used for drawing irregular curves that cannot be drawn by compasses. BIS & ISO Drawing Conventions. The International Standards Organization (ISO) Geneva has formulated International standards for Engineering Drawing. The Bureau of Indian Standards (BIS) previously known as Indian Standards Institution (ISI) has adopted the ISO standards. The ISO standards are applicable to the following topics: • Layout of Drawing sheet • Line Types • Lettering in Drawing • Dimensioning Methods • Arrows Layout of Drawing Sheet. Engineering students generally use A2 or A3 size drawing sheets. After fixing the drawing sheet on to the drawing board, the "Border lines" and the "Title block" are first drawn. The Borderlines: An ideal working space for drawing is obtained by drawing the borderlines. The following steps are involved in drawing the borderlines: Draw a filing margin of 30 mm width at the left-hand edge of he drawing sheet. Provide margins of a minimum of 10 mm each at the top, bottom and right side of the drawing sheet. Use an HB pencil for drawing the borderlines.
Слайд: Introduction to Graphic Communication Ұсынылатын әдебиеттер тізімі: 1. Wuttet Taffesse, Laikemariam Kassa. Engineering Drawing. The Carter Center, the Ethiopia Ministry of Health, and the Ethiopia Ministry of Education. 2005 2..Peter A. Koenig, Design Graphics, Drawing Techniques for Design Professionals, Third Edition, Doorling Kindersley, India Pvt. Lt., 2012. Бақылау сұрақтары 1. Are Compasses use in conjunction with scales? 2. Sharpener and Emery Paper. 3. What constitutes of instrument box?
Lecture 3. Drawing 1. Artistic Drawings. Technical Drawings 2. Types of Technical Drawings 3. Purpose of Technical Drawings 4. Application of Technical Drawings
Purpose: At the end of this chapter students should be able to: ♦ Define graphic communication ♦ Explain the difference between different types of drawings ♦ Mention types of drawing ♦ Mention some of the applications of technical drawings
Keywords: drawing, Artistic and Technical drawings, projection Parallel Projection,Oblique Projections, Orthographic projections, Axonometric Projections
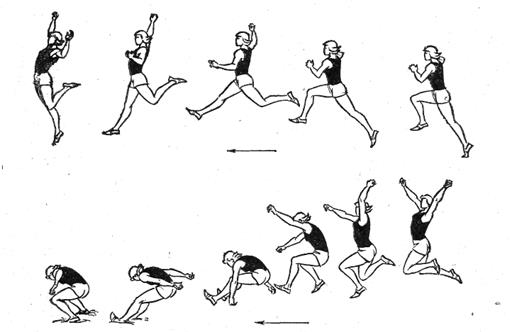
A drawing is a graphic representation of an object, or a part of it, and is the result of creative thought by an engineer or technician. When one person sketches a rough map in giving direction to another, this is graphic communication. Graphic communication involves using visual materials to relate ideas. Drawings, photographs, slides, transparencies, and sketches are all forms of graphic communication. Any medium that uses a graphic image to aid in conveying a message, instructions, or an idea is involved in graphic communication. One of the most widely used forms of graphic communication is the drawing. Technically, it can be defined as “a graphic representation of an idea, a concept or an entity which actually or potentially exists in life. Drawing is one of the oldest forms of communicating, dating back even farther than verbal communication. The drawing itself is a way of communicating all necessary information about an abstract, such as an idea or concept or a graphic representation of some real entity, such as a machine part, house or tools. There are two basic types of drawings: Artistic and Technical drawings. 2.1 Artistic Drawings Artistic Drawings range in scope from the simplest line drawing to the most famous paintings. Regardless of their complexity, artistic drawings are used to express the feelings, beliefs, philosophies, and ideas of the artist. In order to understand an artistic drawing, it is sometimes necessary to first understand the artist. Artists often take a subtle or abstract approach in communicating through their drawings, which in turn gives rise to various interpretations. (see figure 1.1)
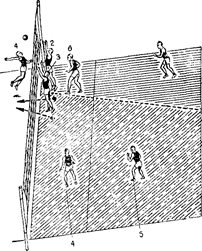
2.2 Technical Drawings The technical drawing, on the other hand, is not subtle, or abstract. It does not require an understanding of its creator, only an understanding of technical drawings. A technical drawing is a means of clearly and concisely communicating all of the information necessary to transform an idea or a concept in to reality. Therefore, a technical drawing often contains more than just a graphic representation of its subject. It also contains dimensions, notes and specifications. (See figure 1.2)
Слайдтар: Artistic Drawings Ұсынылатын әдебиеттер тізімі: 1.Wuttet Taffesse, Laikemariam Kassa. Engineering Drawing. The Carter Center, the Ethiopia Ministry of Health, and the Ethiopia Ministry of Education. 2005 2.Peter A. Koenig, Design Graphics, Drawing Techniques for Design Professionals, Third Edition, Doorling Kindersley, India Pvt. Lt., 2012. Бақылау сұрақтары 1. Mention the main drawing equipments 2. Explain the use of different drawing equipments 3. Discuss the different type of pencils with their use
♦ Mention types of drawing ♦ Mention some of the applications of technical drawings
Keywords: Parallel Projection,Oblique Projections, Orthographic projections, Axonometric Projections A. Types of Technical Drawings Technical drawings are based on the fundamental principles of projections. A projection is a drawing or representation of an entity on an imaginary plane or planes. This projection planes serves the same purpose in technical drawing as is served by the movie screen. A projection involves four components 1. The actual object that the drawing or projection represents 2. The eye of the viewer looking at the object 3. The imaginary projection plane 4. Imaginary lines of sight called Projectors The two broad types of projections, both with several subclassifications, are parallel projection and perspective projection. Parallel Projection Parallel Projection is a type of projection where the line of sight or projectors are parallel and are perpendicular to the picture planes. It is subdivided in to the following three categories: Orthographic, Oblique and Axonometric Projections. ♦ Orthographic projections: are drawn as multi view drawings, which show flat representations of principal views of the subject. ♦ Oblique Projections: actually show the full size of one view. ♦ Axonometric Projections: are three-dimensional drawings, and are of three different varieties: Isometric, Dimetric and Trimetric.
Perspective Projection Perspective projections are drawings which attempt to replicate what the human eye actually sees when it views an object. There are three types of perspective projections: Onepoint, Two-point and Three-point Projections.
B. Purpose of Technical Drawings To appreciate the need for technical drawings, one must understand the design process. The design process is an orderly, systematic procedure used in accomplishing a needed design. Any product that is to be manufactured, fabricated, assembled, constructed, built, or subjected to any other types of conversion process must first be designed. For example, a house must be designed before it can be built. C. Application of Technical Drawing Technical drawings are used in many different applications. They are needed in any setting, which involves design, and in any subsequent forms of conversion process. The most common applications of technical drawings can be found in the fields of manufacturing, engineering and construction. For instance, Surveyors, civil engineers, sanitarians use technical drawings to document such works as the layout of a new subdivisions, or the marking of the boundaries for a piece of property. Contractors and construction personnel use technical drawings as their blue prints in converting architectural and engineering designs in to reality.
Figure 1.7 Technical drawing (architectural)
Слайдтар: Technical Drawings Ұсынылатын әдебиеттер тізімі: 1. Wuttet Taffesse, Laikemariam Kassa. Engineering Drawing. The Carter Center, the Ethiopia Ministry of Health, and the Ethiopia Ministry of Education. 2005 2..Peter A. Koenig, Design Graphics, Drawing Techniques for Design Professionals, Third Edition, Doorling Kindersley, India Pvt. Lt., 2012. Бақылау сұрақтары 1. Discuss the different types of drawing 2. Explain the different application of technical drawing 3. What is Purpose of Technical Drawings?
Lecture 4. Lettering and Lines 4.1. Spacing Of Letters 4.2. Lettering In Maps 4.3. Conventional Lines
Purpose: At the end of this chapter students should be able to: ♦ Write letters according to the standard ♦ Explain the different line types ♦ Mention the application of each line type in technical drawings Keywords: Lettering, Lines, Letter styles, Vertical capital
Letter styles are generally classified as Gothic, Roman, Italic and Text. They were all made with speedball pens, and are therefore largely single-stroke letters. If the letters are drawn in outline and filled in, they are referred to as “filled- in” letters. The plainest and most legible style is the gothic from which our single-stroke engineering letters are derived. The term roman refers to any letter having wide down ward strokes and thin connecting strokes. Roman letters include old romans and modern roman, and may be vertical or inclined. Inclined letters are also referred to as italic, regardless of the letter style; text letters are often referred to as old English.
Spacing of Letters Uniformity in spacing of letters is a matter of equalizing spaces by eye. The background area between letters, not the distance between them, should be approximately equal. Some combinations, such as LT and VA, may even have to be slightly overlapped to secure good spacing. In some cases the width of a letter may be decreased. For example, the lower stroke of the L may be shortened when followed by A. Words are spaced well apart, but letters with in words should be spaced closely. Make each word a compact unit well separated from the adjacent words. For either upper case or lower-case lettering, make the spaces between words approximately equal to a capital O. Avoid spacing letters too far apart and words too close together.
Lettering in Maps Letters are generally used on maps as follows: ♦ Vertical capital: name of states, countries, towns, capitals, titles of the map etc ♦ Vertical lower case: name of small towns, villages, post offices etc. ♦ Inclined capital: name of oceans, bays, gulfs, large lakes, rivers etc. ♦ Inclined lower case: name of rivers, creeks, small lakes, ponds, marshes and springs
Conventional Lines Each line on a technical drawing has a definite meaning and is drawn in certain ways. There are certain conventional lines recommended by American Standard Association. According to the standard,” three widths of line;, thick, medium, and thin are recommended… exact thickness may vary according to the size and type of drawing…” There should also be a distinct contrast in the thickness of different kinds of lines, particularly between the thick lines and thin lines. In technical drawings, make construction lines so light that they can barely be seen, with a hard sharp pencil such as 4H to 6H. For visible lines, hidden lines, and other “thick” lines use relatively soft pencils, such as F or H. All thin lines except construction line must be thin, but dark. They should be made with a sharp medium grad pencil, such as H or 2H.
Figure. Conventional lines
Слайдтар: Lettering and Lines
Ұсынылатын әдебиеттер тізімі: 1.Wuttet Taffesse, Laikemariam Kassa. Engineering Drawing. The Carter Center, the Ethiopia Ministry of Health, and the Ethiopia Ministry of Education. 2005 2.Peter A. Koenig, Design Graphics, Drawing Techniques for Design Professionals, Third Edition, Doorling Kindersley, India Pvt. Lt., 2012. Бақылау сұрақтары: 1. Discuss the different types of lines 2. Explain the application of each line types in technical drawings
Lecture 5-6. Geometric Construction 5.1. Introduction 5.2. Geometric Nomeniclature 5.3. Techniques of Geometric Constructions
Purpose: At the end of this chapter students should be able to: ♦ Define geometric nomenclatures like angles, lines etc ♦ Discuss the steps to construct different geometric figures like lines, arcs, polygon, ellipse etc
Keywords: geometric construction, lines, arcs, polygon, ellipse
Strict interpretation of geometric construction allows use of only the compass and an instrument for drawing straight lines, and with these, the geometer, following mathematical theory, accomplishes his solutions. In technical drawing, the principles of geometry are employed constantly, but instruments are not limited to the basic two as T-squares, triangles, scales, curves etc. are used to make constructions with speed and accuracy. Since there is continual application of geometric principles, the methods given in this chapter should be mastered thoroughly. It is assumed that students using this book understand the elements of plane geometry and will be able to apply their knowledge. The constructions given here afford excellent practice in the use of instruments. Remember that the results you obtain will be only as accurate as your skill makes them. Take care in measuring and drawing so that your drawings will be accurate and professional in appearance.
Geometric nomeniclature A. POINTS IN SPACE A point is an exact location in space or on a drawing surface. A point is actually represented on the drawing by a crisscross at its exact location. The exact point in space is where the two lines of the crisscross intersect. When a point is located on an existing line, a light, short dashed line or cross bar is placed on the line at the location of the exact point. Never represent a point on a drawing by a dot; except for sketching locations. B. LINE Lines are straight elements that have no width, but are infinite in length (magnitude), and they can be located by two points which are not on the same spot but fall along the line. Lines may be straight lines or curved lines.A straight line is the shortest distance between two points. It can be drawn in any direction. If a line is indefinite, and the ends are not fixed in length, the actual length is a matter of convenience. If the end points of a line are important, they must be marked by means of small, mechanically drawn crossbars, as described by a pint in space. Straight lines and curved lines are considered parallel if the shortest distance between them remains constant. The symbol used for parallel line is //. Lines, which are tangent and at 900 are considered perpendicular. The symbol for perpendicular line is ⊥.
Figure. Points and lines
Techniques of Geometric Constructions To construct the above mentioned geometric figures, we have to know some principles and procedures of geometric construction. Thus, the remaining of this chapter is devoted to illustrate step-by-step geometric construction procedures used by drafters and technicians to develop various geometric forms. A. How to Bisect a Line or an Arc To bisect a line means to divide it in half or to find its center point. In the given process, a line will also be constructed at the exact center point at exactly 900. Given: Line A-B Step 1: Set the compass approximately two-thirds of the length of line A-B and swing an arc from point A. Step 2: Using the exact same compass setting, swing an arc from point B. Step 3: At the two intersections of these arcs, locate points D and E Step 4: Draw a straight-line connecting point D with point E. Where this line intersects line A-B, it bisects line A-B. Line D-E is also perpendicular to line A-B at the exact center point.
Figure. Example on how to bisect a line or arc
Слайдтар: Geometric Construction Ұсынылатын әдебиеттер тізімі: 1.Wuttet Taffesse, Laikemariam Kassa. Engineering Drawing. The Carter Center, the Ethiopia Ministry of Health, and the Ethiopia Ministry of Education. 2005 2.Peter A. Koenig, Design Graphics, Drawing Techniques for Design Professionals, Third Edition, Doorling Kindersley, India Pvt. Lt., 2012. Бақылау сұрақтары: 1. The side of a certain triangle is 2 cm. Construct an equilateral triangle based on the given side by using compass and ruler. 2. Show the procedure how to divide a line in to number of equal parts 3. Draw a line parallel to straight line AB at 2cm distance.
Lecture 7. Projection 7.1. Introduction 7.1.1. Isometric Drawing 7.1.2. Orthographic Or Multi View Projection 7.2. Theory Of Multi View Projections
Purpose: At the end of this chapter, the students should be able to: ♦ Explain the purpose and theory of multi view projections ♦ Describe “Glass Box Method” of orthographic projection ♦ Mention the principal views and combination of views Keywords: Isometric Drawing, Multi View Projections, oblique drawings
All forms of engineering and technical work require that a twodimensional surface (paper) be used to communicate ideas and the physical description of a variety of shapes. Here projections have been divided in to two basic categories; pictorial and multi view. This simple division separates single view projections (oblique, perspective and isometric) from multi view projections (orthographic). Theoretically, projections can be classified as convergent and parallel, or divided in to three systems of projection: perspective, oblique, and orthographic. Division of types based on whether the drawing is a one view or multi view projection sufficiently separate projection types in to those used for engineering working drawings (orthographic) and those used for display (architectural rendering, technical illustrations etc) In short, one of the best ways to communicate one's ideas is through some form of picture or drawing. This is especially true for the engineer. The purpose of this chapter is to give you the basics of engineering sketching and drawing. We will treat "sketching" and "drawing" as one. "Sketching" generally, means freehand drawing. "Drawing" usually, means using drawing instruments, from compasses to computers to bring precision to the drawings. Before we get started on any technical drawings, let's get a good look at this strange block (figure 5.1) from several angles.
Isometric Drawing The representation of the object in figure 2 is called an isometric drawing. This is one of a family of three-dimensional views called pictorial drawings. In an isometric drawing, the object's vertical lines are drawn vertically, and the horizontal lines in the width and depth planes are shown at 30 degrees to the horizontal. When drawn under these guidelines, the lines parallel to these three axes are at their true (scale) lengths. Lines that are not parallel to these axes will not be of their true length.
Any engineering drawing should show everything: a complete understanding of the object should be possible from the drawing. If the isometric drawing can show all details and all dimensions on one drawing, it is ideal. One can pack a great deal of information into an isometric drawing. Look, for instance, at the instructions for a home woodworker in figure 2. Everything the designer needs to convey to the craftsperson is in this one isometric drawing. However, if the object in figure 2 had a hole on the back side, it would not be visible using a single isometric drawing. In order to get a more complete view of the object, an orthographic projection may be used. Orthographic or Multi view Projection Imagine that you have an object suspended by transparent threads inside a glass box, as in figure 3.
Then draw the object on each of three faces as seen from that direction. Unfold the box (figure 4) and you have the three views. We call this an "orthographic" or "multi view" drawing.
Figure 4 the creation of an orthographic multi view drawing Figure 5 shows how the three views appear on a piece of paper after unfolding the box.
Figure 5 a multi view drawing and its explanation
Theory of Multi view Projections Multi view orthographic projection is the primary means of graphic communication used in engineering work. Drawings are used to convey ideas, dimensions, shapes, and procedures for the manufacture of the object or construction of a system. Orthographic projection is the basis of all descriptive geometry procedures. Multi view projection is a procedure that can be used to completely describe an object’s shape and dimensions using two or more views that are normally projected at 900 to each other, or at specified angles.In general, engineering work is complete using this method of projection. The finished drawing is then reproduced and sent to the shop or to the job site. To design and communication every detail to manufacturing groups (Engineers, technicians) descriptions must be prepared. This description must show every aspect of the shape and size of each part and of the complete structure. Because of this necessity graphics is the fundamental method of communication only as a supplement, for notes and specifications, is the word language used. Shape is described by projection that is by the process of causing an image to be formed by rays of sight taken in a particular direction from an object to a picture plane. Methods of projection vary according to the direction in which the rays of sight are taken to the plane. When the rays are perpendicular to the plane, the projective method is Orthographic. If the rays are at an angle to the plane, the projective method is called oblique. Rays taken to a particular station point result in perspective projection. By the methods of perspective, the object is represented as it would appear to the eye. Theory of projection is the basis of background information necessary to shape representation in graphics. Two fundamental methods of shape representation are used. 1. Orthographic view consists of a set of two or more separate views of an object taken from different diretions, generally at right angles to each other and arranged relative to each other in a definite way. Each of the views shows the shape of the object for a particular view direction and collectively the views describe the Object completely. 2. Pictorial view, in which the object is oriented behind and projected up on a single plane. Either oblique on perspective projection is used.
Слайдтар: 1.Projection 2.Orthographic Or Multi View Projection Ұсынылатын әдебиеттер тізімі:
Бақылау сұрақтары: 1.Construct a box for isometric and oblique drawings based on the technical drawing procedure. 2.Describe “Glass box method“ of orthographic projections.
Lecture 8. Projection 8.1.1. Classification of Surfaces and Lines in Orthographic Projections 8.1.2. Precedence of Lines 8.2. Pictorial Projections
Purpose: At the end of this chapter, the students should be able to: ♦ Convert pictorial drawings in to orthographic or multi view projection ♦ Describe representation of circular surfaces, hidden surfaces in orthographic projection ♦ List the precedence of lines in multi view projection ♦ Convert orthographic projection in to isometric projection
Keywords: pictorial drawings, orthographic or multi view projection, precedence of lines, pictorial projections
Classification of surfaces and Lines in Orthographic Projections Any object, depending upon its shape and space position may or may not have some surfaces parallel or perpendicular to the planes of projection. Surfaces are classified according to their space relation ship with the planes of projection i.e. horizontal, frontal and profile surfaces. When a surface is inclined to two of the planes of projection (but perpendicular to the third, the surface is said to be auxiliary or inclined. It the surface is at angle to all three planes, the term oblique or skew is used Although uniform in appearance, the lines on a drawing may indicate three different types of directional change on the object. An edge view is a line showing the edge of a projection. An intersection is a line formed by the meeting of two surfaces where either one surface is parallel and one at an angle or both are at an angle to the plane of projection. A surface limit is a line that indicates the reversal of direction of a curved surface. A. Horizontal, Frontal and Profile Surfaces The edges (represented by lines) bounding a surface may be in a simple position or inclined to the planes of projection depending up on the shape or position, the surface takes is name from the plane of projection. Thus, a horizontal line is a line in a horizontal plane; a frontal line is a line in a frontal plane; and a profile line is a line in a profile plane. When a line is parallel to two planes, the line takes the name of both planes as horizontal frontal, horizontal- profile, or frontal – profile.
Figure 1 Examples of objects having parallel surfaces to the principal planes
B. Inclined Surfaces An edge appears in true length when it is parallel to the plane of projection, as a point when it is perpendicular to the plane and shorter than true length when it is inclined to the plane. Similarly, a surface appears in trey shape when it is parallel to the planes of projection, as alien when it is perpendicular to the plane, and fore shortened when it inclined to the plane. An object with its face parallel to the plans of projection as figure 1; a top, front, and right side surfaces are shown in true shape and the object edges appear either in true length or as points. The inclined surface of the object as figure 2 does not show true shape in any of the views but appears as an edge in front view. The front and rear edges of the inclined surface are in true length in the front view and fore shortened in the top and side views. The top and bottom edges of the inclined surface appear in true length in top and side views and as points in the front view.
Figure 2 Examples of objects having inclined surfaces C. Oblique Surfaces A line that is not parallel to any plane of projection is called an oblique skew line and it does not show in true shape in any of the views, but each of the bounding edges shows interval length in one view and is fore shortened in the other two views,
Figure 3 Examples of objects having oblique surfaces
D. Hidden Surfaces To describe an object with complex internal features completely, a drawing should contain lines representing all the edges, intersections, and surface limits of the objects In any view there will be some parts of the object that can not be seen from the position of the observer, as they will be covered by station of the object closer to the observer’s eye. The edges, intersections, and surface limits of these hidden parts are indicated by a discontinuous line called a dashed line. In figure 4, the drilled hole that is visible in the top-side view is hidden in the front and right side views, and there fore it is indicated in these views by a dashed line showing the hole and the shape as left by the drill.
Figure 4 Examples of objects having hidden surfaces Particular attention should be paid to the execution of these dashed lines. It carelessly drawn, they ruin the appearance of a drawing. Dashed lines are drawn lighten full lines, of short dashes uniform in length with the space between there very short, about 0,25 of the length of the dash. This view shows the shape of the object when viewed from the side and the distance from bottom to top and front to rear. The horizontal and profile planes are rotated in to the same plane as the frontal plane. Thus, related in the same plane, they give correctly the three dimensional shape of the object. E. Curved Surfaces To represent curved surfaces in orthographic projections, center lines are commonly utilized. All the center lines, which are the axes of symmetry, for all symmetrical views are a part of views. 1. Every part with an axis, such as a cylinder will have the axis drawn as center line before the part is drawn. 2. Every circle will have its center at the intersection of two mutually perpendicular center lines.
Precedence of lines In any view there
|
|||||||||
|
|
Последнее изменение этой страницы: 2016-12-11; просмотров: 529; Нарушение авторского права страницы; Мы поможем в написании вашей работы! infopedia.su Все материалы представленные на сайте исключительно с целью ознакомления читателями и не преследуют коммерческих целей или нарушение авторских прав. Обратная связь - 13.58.114.163 (0.019 с.) |

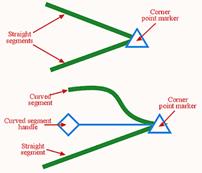

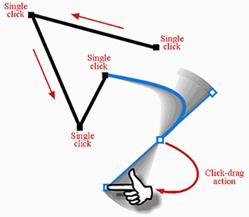


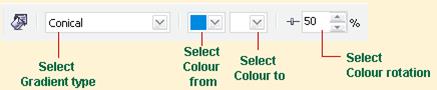
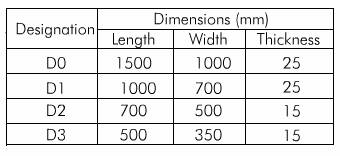
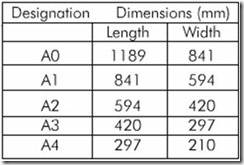
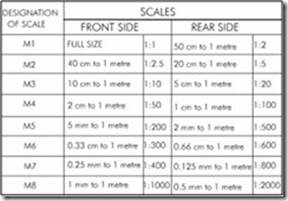
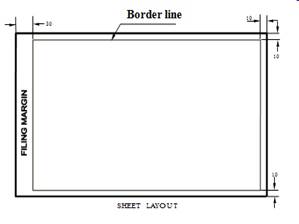
 Figure 1.1 Artistic drawings (Source: Goetsch, Technical drawing 3rd ed. USA: Delmar Publisher Inc., 1994)
 Figure 1.2 Technical Drawings
 Figure 1.3 Orthographic multi view drawing
 Figure 1.4 Oblique drawing

 Figure 1.5 Axonometric drawing
 Figure 1.6 Perspective drawing
 Figure 1 Machine block
 Figure 2 Isometric drawing
 Figure 3 Orthographic projection