Заглавная страница Избранные статьи Случайная статья Познавательные статьи Новые добавления Обратная связь FAQ Написать работу КАТЕГОРИИ: ТОП 10 на сайте Приготовление дезинфицирующих растворов различной концентрацииТехника нижней прямой подачи мяча. Франко-прусская война (причины и последствия) Организация работы процедурного кабинета Смысловое и механическое запоминание, их место и роль в усвоении знаний Коммуникативные барьеры и пути их преодоления Обработка изделий медицинского назначения многократного применения Образцы текста публицистического стиля Четыре типа изменения баланса Задачи с ответами для Всероссийской олимпиады по праву 
Мы поможем в написании ваших работ! ЗНАЕТЕ ЛИ ВЫ?
Влияние общества на человека
Приготовление дезинфицирующих растворов различной концентрации Практические работы по географии для 6 класса Организация работы процедурного кабинета Изменения в неживой природе осенью Уборка процедурного кабинета Сольфеджио. Все правила по сольфеджио Балочные системы. Определение реакций опор и моментов защемления |
Analysis of the current practice of formation and management of resources of JSC Kazkommertsbank
Analysis of the formation, management and evaluation of the capital adequacy of JSC Kazkommertsbank JSC Kazkommertsbank is one of the largest private banks in CIS and the market leader by total assets in Kazakhstan. The Bank provides a wide range of banking and other financial services to corporate and retail clients across the region. Headquartered in Almaty, the Bank serves its retail clients through a network of branches in 45 cities all over Kazakhstan under the KAZKOM logo. In addition, Kazkommertsbank has international banking subsidiaries in Kyrgyzstan, Tajikistan and the Russian Federation. Kazkommertsbank is in operation since 1991, and it is the dominant provider of banking services and other financial products to large and medium-sized corporations across all sectors of the Kazakh economy. The Bank’s employees across the region are devoted to the task of maintaining the Bank’s position as the premier financial services company in Kazakhstan based on superior understanding of our clients' financial needs and the ability to meet these through the highest quality of service. Kazkommertsbank is focused on working with its existing clientele and on asset quality of its loan portfolio. The Bank concentrates its efforts on problem loans on case-by-case basis in line with cooperation with clients to help them improve their operations and increase the recovery rate. Shareholder structure Kazkommertsbank is a public company, with a proportion of its shares, including most of the free float, listed in GDR form on the London Stock Exchange. Kazkommertsbank’s shareholding structure as at 01 January 2013 · JSC "Alnair Capital Holding" - 28,76%; · JSC "Central Asian Investment Company" - 23.83%; · JSC "National Welfare Fund" Samruk-Kazyna "- 21.26%; · The European Bank for Reconstruction and Development, 9.77%; · Subkhanberdin N.S. - 9.32%; · Other shareholders -7.06%.
Note - Compiled by the author according to the data of websitewww.kkb.kz
Figure 4.Kazkommertsbank’s shareholding structure at January 1, 2013
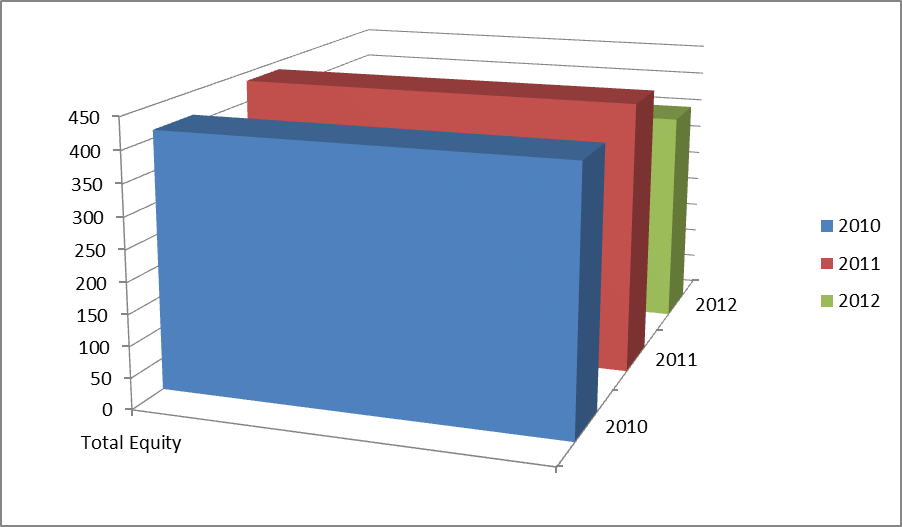
Table 1 Changes in Equity for 2010-2012 (mln.KZT)
The share of capital in total equity of the bank shows the extent of forming its own capital through equity. The share capital as compared to 2010 decreased, but not by much: in the period 2010-2012, its share has decreased by 0.25%. Analyzing the dynamics of the bank's own funds it can be concluded that the observed downward trend of total equity by reducing the share premium (16,925 mln.tg) and retained earnings (113,208 mln.tg). Other provisions in 2012 compared with 2010 have a positive trend and increased by 7508%. However, the increase of this indicator is negative and may be associated with increased risks of banking (credit risk, interest rate risk). Shareholders' equity decreased over the period from 413.746 to 353.466 million KZT that is decreased for 60, 294 million KZT or 14,6 %.
Note - Compiled by the author according to the data of website www.afn.kz
Figure 5.Changes in Total equity 2010-2012 (mln. KZT)
Return on equity Shows the return on shareholders' investment, in terms of accounting profits. The formula for calculating the return on equity: ROE = Net Income / Equity, (1)
Table 2 Return on Equity
At calculation of ROE, we used data on net income and book value of equity excluding preferred shares. In fact, the main indicator for strategic investors help determine the efficiency of capital invested by the owner of the enterprise. Return on equity shows how much currency net profits earned each unit invested owners of the company. Return on equity shows the amount of net profit that was generated net worth companies, characterizes the degree of attractiveness of the object for investment of the shareholders. The higher the coefficient of ROE, the higher the profit attributable to the share, and the larger the potential dividends.
Management of the Bank’s own Capital In accordance with the established quantitative targets for capital adequacy The Bank is required to comply with the requirements to maintain minimum amounts and ratios of capital adequacy and Tier I capital to assets weighted by risk. Capital adequacy requirements are set by the FMSC and controlled using the principles, methods and factors identified by the Basel Committee on Banking Supervision.
Table 3 Execution of prudential and other standards of JSC Kazkommertsbank
a According to the principles applied by Basel Committee. b As at 31 December2012 and 2011, in the computation of total capital for capital adequacy purposes the line “Retained earnings” included statutory reserve, which is required by legislation of the Republic of Kazakhstan and reflected in IFRS financial statements since 1 July 2011. c Innovative instruments represents perpetual bonds. d The line “Property and equipment revaluation reserve” includes discounted amount of investments available-for-sale securities revaluation reserve/(deficit) (in accordance with the Basel standards). e As at 31 December 2012, 2011 and 2010, the Group included in the computation of total capital for capital adequacy purposes the subordinated debt received, which is not to exceed 50% of Tier 1 capital. In the event of bankruptcy or liquidation of the Bank, repayment of this debt is subordinate to the repayments of the Bank’s liabilities to all other creditors. During the years ended 31 December 2012, 2011 and 2010, the Group complied with all set capital requirements. The Group manages its capital to ensure that entities in the Group will be able to continue as a going concern while maximising the return to stakeholders through the optimisation of the debt and equity balance. The capital structure of the Group consists of debt, which includes subordinated and perpetual debt and equity comprising issued capital, reserves and retained earnings as disclosed in the consolidated statement of changes in equity. Based on the recommendations of the Management Board by making decisions on the Board of Directors or shareholders meeting, the Group balances its overall capital structure through new share issues, issues of new debt or the redemption of existing debt, and the payment of dividends. The Group’s overall capital risk management policy remains unchanged in comparison with 2011and 2010. Risk-weighted assets and contingent liabilities decreased by 5.5% to KZT 2,249 billion at 31 December 2012 compared to KZT2,380 billion as at 31 December 2011. On a consolidated basis, the Bank’s Core Tier 1 ratio at 31 December 2012 was 13.7% compared with 18.6% at 31 December 2011. Total capital ratio was 16.9% as at 31 December 2012 compared to 22.3% at 31 December 2011. Based on the analysis of the possible impact of planned changes in the regulations, the Bank identified negative consequences for its regulatory capital, open currency position and liquidity. The impact of these negative consequences was avoided as a result of additional one-off specific provisions under IFRS out of excess capital and earnings of 2012. Consequently: · IFRS reserves equalled reserves under Kazakh regulations · Capital adequacy remained well above the minimum requirements · Core Tier 1 ratio of 13.7% which is 2.7 times higher than the minimum 5% ratio · Total capital ratio of 16.9% which is 1.7 times higher than the minimum requirement of 10% · Provisioning rate at 32.5% of gross loans up from 24% · NPLs did not change significantly and stood at 29.0% of gross loans compared to 28.6% in 2011 As a result of one-off additional IFRS provisioning charges net loss amounted to KZT130.9 bn compared to net income of KZT23.5 bn in the previous year.
Bank capital adequacy The capital adequacy of commercial bank - the bank rate, expressed as the ratio of shareholders' equity to total volume of assets weighted for risk. This ratio should not be less than 10%, follows from the calculations - the coefficient of compliance.
BCA= Total equity/Total assets * 100% (2)
BCA2010= 413 746/2 688 108*100=15% (2) BCA2011=436 632/2 565 689*100=17% BCA2012=353 466/2 598 337 *100=14%
where, BCA- bank capital adequacy
Table 4 Capital adequacy
According to the FSA as at 01.07.2012. Bank with a margin carries out prudential standards on capital adequacy K1-1 and K2, as well as the current liquidity K4.
Note - Compiled by the author according to the website www.afn.kz
Figure 6. Capital adequacy ratio (2010-2012)
In calculating the capital adequacy ratio as at 31 December 2012, 2011 and 2010the bank included in the calculation of capital obtained a subordinated loan in the amount not exceeding 50% of Tier I capital. In the event of bankruptcy or liquidation of the Bank, repayment of this debt is the Bank's liabilities to all other creditors. For the years ended December 31, 2012, 2011 and 2010the bank fully complied with all established requirements for the capital.
|
|||||||||||||||||||||||||||||||||||||||||||||||||||||||||||||||||||||||||||||||||||||||||||||||||||||||||||||||||||||||||||||||||||||||||||||||||||||||||||||||||||||||||||||
|
|
Последнее изменение этой страницы: 2016-08-06; просмотров: 220; Нарушение авторского права страницы; Мы поможем в написании вашей работы! infopedia.su Все материалы представленные на сайте исключительно с целью ознакомления читателями и не преследуют коммерческих целей или нарушение авторских прав. Обратная связь - 52.14.204.52 (0.009 с.) |