Заглавная страница Избранные статьи Случайная статья Познавательные статьи Новые добавления Обратная связь КАТЕГОРИИ: ТОП 10 на сайте Приготовление дезинфицирующих растворов различной концентрацииТехника нижней прямой подачи мяча. Франко-прусская война (причины и последствия) Организация работы процедурного кабинета Смысловое и механическое запоминание, их место и роль в усвоении знаний Коммуникативные барьеры и пути их преодоления Обработка изделий медицинского назначения многократного применения Образцы текста публицистического стиля Четыре типа изменения баланса Задачи с ответами для Всероссийской олимпиады по праву 
Мы поможем в написании ваших работ! ЗНАЕТЕ ЛИ ВЫ?
Влияние общества на человека
Приготовление дезинфицирующих растворов различной концентрации Практические работы по географии для 6 класса Организация работы процедурного кабинета Изменения в неживой природе осенью Уборка процедурного кабинета Сольфеджио. Все правила по сольфеджио Балочные системы. Определение реакций опор и моментов защемления |
Demand for Ice Cream Cones Near Your School
0 50 100 150 200 250 300 Number of cones
Supply Thus far we have only spoken about the effects of prices on buyers. But it takes two parties to make a sale: buyers and sellers. To the economist supply refers to the number of items that sellers will offer for sale at different prices at a particular time and place. A supply schedule is a table summarizing this information. The table below is the supply schedule that was in effect that day in April when your friends conducted their survey. It tells us how many ice cream cones they were willing to sell the students at the prices indicated. The Law of Supply. As the supply schedule indicates, more ice cream cones would be offered for sale at higher prices than at lower ones. This is in keeping with the law of supply which states that sellers will offer more of a product at a higher price and less at a lower price. Why does the quantity of a product supplied change if its price rises or falls? The answer is that producers supply things to make a profit. The higher the price, the greater the incentive to produce and sell the product. If ice cream prices around your school are high, your friends may buy a larger ice cream maker so they can produce and sell more ice cream. Additionally, if word gets out that ice cream sells for a relatively high price near your school, other vendors will be tempted to leave their present locations and come to your high school in the belief that they can make more profit.
Our supply schedule is based on holding variables other than price at some fixed or constant level. On this basis we can use the supply schedule to draw the supply curve (Figure below). Supply for Ice Cream Cones Near Your School Price per Cone Price per Cone
Number of cones
0 50 100 150 200 250 300 Number of cones
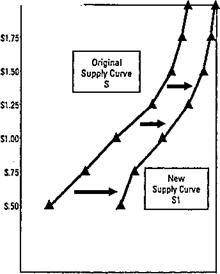
As in the case of demand, supply curves need not be straight lines. Unlike demand, the typical supply curve slopes upward from left to right. Changes in Supply. When supply changes, the entire supply curve shifts either to the right or to the left. This is simply another way of saying that sellers will be offering either more (if supply has increased) or less (if supply has decreased) of an item at every possible price. Any or all of the following changes are likely to affect the quantities supplied. Ø Changes in the cost of production. If it costs sellers less to produce their products, they will be able to offer more of them for sale. An increase in production costs will have the opposite effect — supply will decrease. Ø Other profit opportunities. Most producers can make more than one product. If the price of a product they have not been producing (but could if they chose to) increases, many will shift their output to that product. For example, as personal computers increased in popularity, a need developed for computer stands. As a result, many furniture manufacturers began to produce desks and carts specifically designed for the computer market. Ø Future expectations. If producers expect prices to increase in the future, they may increase their production now to be in position to profit later. Similarly, if prices are expected to decline in the future, producers may reduce production, and supply will fall. Changes in supply are illustrated graphically in Figure 6.
The price at which supply exactly equals demand is known as the market price, or the point of equilibrium. In the table above, the market price would be $1.00 because at that price the quantity of ice cream cones demanded and the quantity supplied are exactly equal. Figure 8 represents this information graphically.
Supply of and Demand for Ice Cream Cones near your School Number of cones Equilibrium Supply and demand schedules tell us how many items buyers would purchase and how many items sellers would offer at different prices. By themselves they do not tell us at what price goods or services would actually change hands. When the two forces are brought together, however, something quite significant takes place. The interaction of supply and demand will result in the establishment of an equilibrium or market price. The market price is the one at which goods or services will actually be exchanged for money. Exercise 1.Translate and identify what terms are meant. 1. Графическое изображение взаимосвязи между рыночной ценой товара или услуги и тем количеством, которое по этой цене будут спрашивать покупатели. 2. Положение на рынке, при котором количество товаров или услуг, которые хотят приобрести потребители, абсолютно идентично количеству товаров и услуг, которые желают преложить производители, и, таким образом, силы, влияющие на спрос и предложение на рынке, сбалансированы. 3. Степень изменения в количестве предлагаемых товаров и услуг в ответ на изменения в их цене, измеряемая как отношение процентного изменения в количестве к процентному изменению в цене. 4. Желание и способность продавцов поставлять на рынок товары для продажи. 5. Группа товаров и услуг, для которых рост цены на один из них приведет к увеличению спроса на все другие. Такими товарами являются, например, чай и кофе. 6. Закон, отражающий взаимосвязь между количеством потребляемого блага и степенью удовлетворенности от потребления каждой дополнительной единицы. Exercise 8.6 (Study Guide).Complete the text using the words in the box.
In everyday language we refer to an increase in demand..... between shifts in the demand curve and movements along a given demand curve. The demand curve..... when any of the factors..... quantity demanded (other than the price of the good) change. Such shifts show the..... of consumers to changes in the prices of other goods, income, tastes, and...... ....., a movement along a demand curve shows the response of quantity demanded to a change in the..... of the good itself. Why does the difference.....? A shift of the demand causes..... price and quantity to change, but..... along the demand curve are just part of the process by which the market comes into equilibrium. This distinction between the two kinds of demand change is very...... Movement along the demand curve represents consumer..... to changes in the market price. Shifts in the demand represent adjustment to outside factors (other prices, income, tastes) and lead..... to changes in equilibrium price and......
|
||||||||||||||||||||||||||||||||||||||
|
|
Последнее изменение этой страницы: 2016-04-08; просмотров: 729; Нарушение авторского права страницы; Мы поможем в написании вашей работы! infopedia.su Все материалы представленные на сайте исключительно с целью ознакомления читателями и не преследуют коммерческих целей или нарушение авторских прав. Обратная связь - 18.218.127.141 (0.006 с.) |

 Price per Cone