Заглавная страница Избранные статьи Случайная статья Познавательные статьи Новые добавления Обратная связь КАТЕГОРИИ: ТОП 10 на сайте Приготовление дезинфицирующих растворов различной концентрацииТехника нижней прямой подачи мяча. Франко-прусская война (причины и последствия) Организация работы процедурного кабинета Смысловое и механическое запоминание, их место и роль в усвоении знаний Коммуникативные барьеры и пути их преодоления Обработка изделий медицинского назначения многократного применения Образцы текста публицистического стиля Четыре типа изменения баланса Задачи с ответами для Всероссийской олимпиады по праву 
Мы поможем в написании ваших работ! ЗНАЕТЕ ЛИ ВЫ?
Влияние общества на человека
Приготовление дезинфицирующих растворов различной концентрации Практические работы по географии для 6 класса Организация работы процедурного кабинета Изменения в неживой природе осенью Уборка процедурного кабинета Сольфеджио. Все правила по сольфеджио Балочные системы. Определение реакций опор и моментов защемления |
Unit 8. Describing statistics
READING I Ex. 1. Discuss the questions. 1. Name some of the sectors of employment 2. Which sectors employ the most people in your country? 3. Has the number of employees in the different sectors changed in recent years? 4. Which sector would you like to work in?
Ex. 2. Survey the text Work trends. Which graphic is a line graph? a bar chart? a pie chart? Ex. 3. Skim the title, text, and graphics. Answer the questions. 1. What do the graphics show? 2. How are they different? 3. What do you notice about the number of people employed in agriculture and services in 2005? 4. In which sector did the number of jobs rise between 1995 and 2005? 5. How has the number of people working in IT changed? Ex. 4. Read the text and look at the graphics. Answer the questions. 1. Why has there been a decrease in the number of jobs in the textile industry? 2. What has happened to the number of jobs in the industrial sector? 3. What two things do you learn about employment trends in South-East Asia? 4. What happened to employment in IT in the 1990s? 5. How have developments in ICTs affected the way work is done? Ex. 5. Underline the correct words in italics to complete the sentences, using information from the text and figures 1-3. 1. There were almost as many / not nearly as many people working in industry as in agriculture in 2005. 2. Between 1995 and 2005 there was a slight / substantial decrease in jobs in industry. 3. In 1998 there were considerably / marginally more jobs in IT than in 1992. 4. Five per cent / A tenth of all jobs will be in ICTs in the future. 5. Economists predict there will be an increase / a decrease in the number of people working in industry in the future. TEXT 1. Work trends
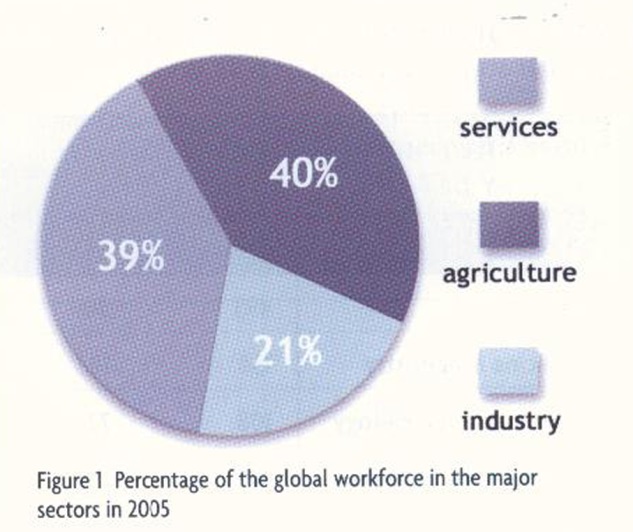
Figure 1 shows the overall distribution of jobs in the three major sectors in 2005: agriculture, industry, and services. It can be seen that almost the same percentage of people worked in services as in agriculture, whereas only around 20% were employed in industry. In the ten years leading up to 2005, substantial changes in employment took place, reflecting changes in technology and lifestyle. As Figure 2 illustrates, a significant change took place in the agricultural sector. In 1995 43% of the world’s workforce was employed in agriculture; by 2005 this number had fallen to 40%. The largest decline was in South-East Asia and the Pacific, where the figures dropped by 12%.
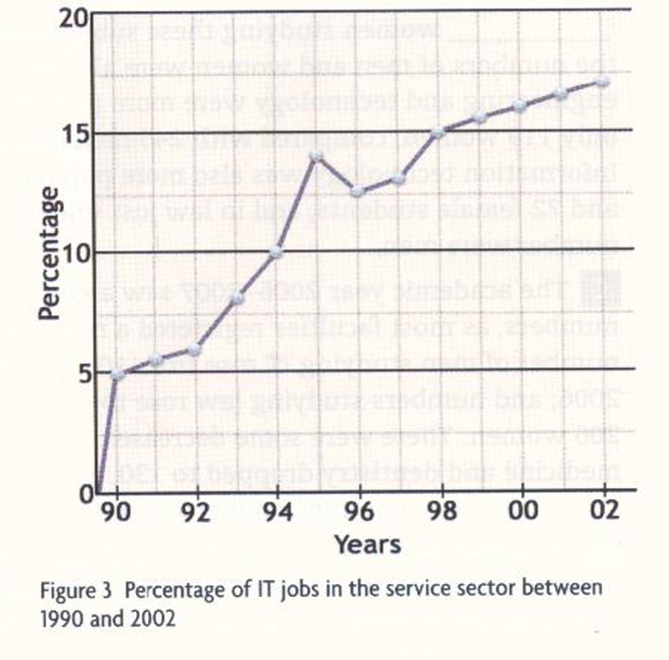
However, one sector saw an increase. The service sector employed 34% of the workforce in 1995, but by 2005 this had risen to 39%. This extremely varied sector includes the retail trade, tourist-related services such as hotels and restaurants, as well as transport, communications, finance, property, research and development, education, and health care. The largest developments were seen in the new Information and Communications Technologies (ICTs), which have grown rapidly since the 1990s. The developments in Ids have had a huge impact on jobs in all sectors, as computer technology has radically affected the way in which work is done. The means of production, distribution, and communication have all been transformed. The number of jobs in IT as a percentage of all jobs in the service sector is Represented in Figure 3. Although there was a slight drop in the numbers of jobs in IT in the mid-1990s due to a recession, the overall trend was upward. As technology spreads across the world, this rise in jobs will continue. It is estimated that one in twenty new jobs will be in ICTs in the future. Economists predict that these overall tendencies will continue. There will be a further increase in service-sector employment, and in particular in Ids, but health care and education will also benefit from more jobs. At the same time, fewer people will be employed in industry and agriculture.
READING II Ex. 1 Skim TABLE 1. What was the most popular subject for women and the least popular subject for men in both years?
|
||||||
|
|
Последнее изменение этой страницы: 2021-07-18; просмотров: 254; Нарушение авторского права страницы; Мы поможем в написании вашей работы! infopedia.su Все материалы представленные на сайте исключительно с целью ознакомления читателями и не преследуют коммерческих целей или нарушение авторских прав. Обратная связь - 18.220.1.239 (0.004 с.) |
 The type of work which people do is constantly changing as man develops and modifies his way of living. One hundred years ago, the vast majority of people worked in agriculture, but now less than half the world’s population do so. In fact, in only ten years major changes have been seen in the percentage of the workforce employed in various sectors.
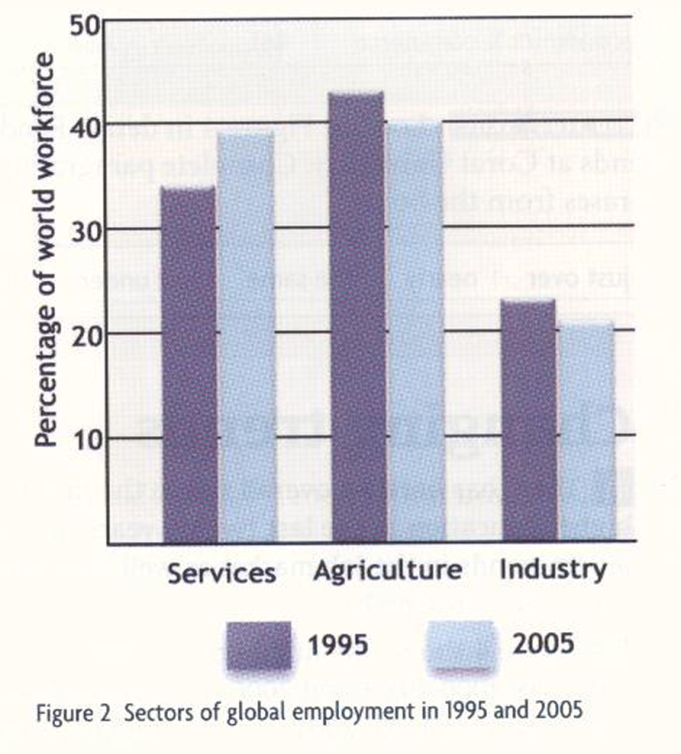
 Similarly, in industry the workforce fell by two per cent globally. Manufacturing was the largest sub-sector of industry to be affected. However, these figures represent only an overall picture as some countries saw industrial employment actually rise by one per cent. This was particularly noticeable in certain South-East Asian countries, where low wages and fast industrialization have enabled countries like China to become world leaders in manufacturing. In other sub-sectors of industry such as textiles, the global workforce dropped from 14.5 million in 1990 to 13 million in 2000, as increasing automation reduced the number of employees needed.