Заглавная страница Избранные статьи Случайная статья Познавательные статьи Новые добавления Обратная связь КАТЕГОРИИ: ТОП 10 на сайте Приготовление дезинфицирующих растворов различной концентрацииТехника нижней прямой подачи мяча. Франко-прусская война (причины и последствия) Организация работы процедурного кабинета Смысловое и механическое запоминание, их место и роль в усвоении знаний Коммуникативные барьеры и пути их преодоления Обработка изделий медицинского назначения многократного применения Образцы текста публицистического стиля Четыре типа изменения баланса Задачи с ответами для Всероссийской олимпиады по праву 
Мы поможем в написании ваших работ! ЗНАЕТЕ ЛИ ВЫ?
Влияние общества на человека
Приготовление дезинфицирующих растворов различной концентрации Практические работы по географии для 6 класса Организация работы процедурного кабинета Изменения в неживой природе осенью Уборка процедурного кабинета Сольфеджио. Все правила по сольфеджио Балочные системы. Определение реакций опор и моментов защемления |
How the economy as a whole worksСтр 1 из 8Следующая ⇒
ECONOMY Scarcity means that society has limited resources and therefore cannot produce all the good and services people wish to have. Economics study how people make decisions, how much they work, what they buy, how much they save, etc. Economics also study how people interact with each other. HOW PEOPLE MAKE DECISIONS 1. People face trade-offs
Efficiency means that society is getting the most it can from its scarce resources Equality means that the benefits of those resources are distributed fairly among.
2. The cost of something is what you give up to get it The opportunity cost of an item is what you give up to get that item.
3. Rational people think at the margin Economists use the term maginal changes to describe small incremental adjustments to an existing plan of action. “Margin” means “edge”
4. People respond to incentives When the price of an apple rises, for instance, people decide to eat more pears and fewer apples, because the cost of buying an apple is higher.
HOW PEOPLE INTERACT 5. Trades can make everyone better off. This increase in output is due to specialization: each person specializes in the task that he is good at performing. The economy, as a whole, can produce more when each person specialize in a task and trades with each others.
6. Markets are usually a good way to organize economic activity.
Central planning – only the government could organize economic activity. Market economy – an economy that allocates resources through the decentralized decision of many firms and households as they interact in markets for good and services.
“An inquiry into the nature and causes of the wealth of Nations” – a book of Adam Smith 1776. ”Invisible hand of the marketplace” – Adam Smith.
7. Governments can sometimes improve market outcomes
Market failure – situation in which the market on its own fails to allocate resources efficiently. Example: externality. Externality – is the impact of one person’s actions of the well-being of a bystander Market power refers to the ability of single person.
HOW THE ECONOMY AS A WHOLE WORKS 8. A country’s standard of living depends on its ability to produce goods and services 9. Prices rise once a government brings too much money
Inflation – an increase in the overall level of prices in the economy.
10. Society faces a short-one trade off between inflation and unemployment Phillips curve – a curve that shows a short-run trade off between inflation and unemployment.
Book: Krugman - microeconomics
Comparative advantage and gains from trade
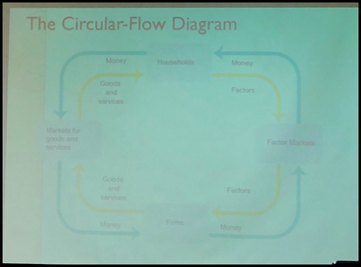
Gains from trade - the mutual gains that individuals can achieve by specializing in doing different things and training with another. Trade based on comparative advantage An individual has a comparative advantage in producing a good or service if the opportunity costs of producing the good is lower for that individual than for other people An individual has an absolute advantage in an activity if he can do it better that other people. Having an absolute advantage is not the same thing as having comparative advantage Trade takes the form of barter when people directly exchange goods or services they have for goods and services they want. Transactions: the circular-flow diagram
The circular-flow diagram is a model that represents the transactions in an economy by flows around the circle Ultimately, factor markets determine the economy’s income distribution, how total income is divided among the owners of the various factors of productions Using models Positive economics is the branch of economic analysis that describes the way the economy actually works Normative economics makes prescriptions about the way the economy should work
A forecast is a simple prediction of the future
Supply and demand The supply and demand model is a model of how a competitive market works. Five key elements: · demand curve · supply curve · demand and supply curve shifts · market equilibrium · changes in the market equilibrium
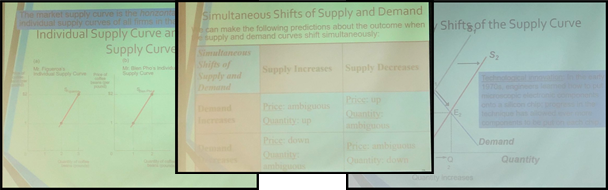
A demand schedule shows how much of a good or service customers will want to buy at different prices. A demand curve - the graphical representation of the demand schedule. It shows how much of a good or a service consumers want to buy at any given price. Increase in demand is a rise in the quantity demanded at any given price. A shift of the demand curve is a change in the quantity demanded at any given price, represented by the change of the original demand curve to a new position, illustrated by a new demand curve. ⁃ Increase in demand - rightward shift ⁃ Decrease in demand - leftward shift Related goods: Substitutes: a fall in the price of one of the goods makes consumers less willing to buy the other good Complements: a fall in the price of one good makes people more willing to buy the other good. Types of goods: (changing in income) ⁃ Normal goods: a rise in income increases the demand for a good ⁃ Inferior goods: a rise in income decreases the demand for a good Change in taste Change in expectations The market demand is the horizontal sum of the individual demand curves of all consumers in the market
A supply curve shows graphically how much of a good or service people are willing to sell at any given price. A shift of a supply curve is a change in the quantity supplied of a good that is the result of a change in the good’s price. Increase - shift to the right Decrease - shifts to the left Market Equilibrium (E) Is a situation in which quantity demanded of a good equals the quantity supplied of that good. The price at which this takes place is the equilibrium price (a.k.a market-clearing price) Surplus when quantity supplied exceeds quantity demanded. Surpluses occur when the price is above its equilibrium level. Shortage of good happens when quantity demanded exceeds the quantity supplied.
Consumer and Producer Surplus Individual consumer surplus is the net gain to an individual buyer from the purchase of a good. It is equal to the difference between the buyer’s willingness to pay and the price paid. Total consumer surplus is the sum of the individual consumer surpluses of all the buyers of a good in a market. The term consumer surplus is often used to refer to both individual and to total consumer surplus. A seller’s cost is the lowest price at which he or she is willing to sell a good. Individual producer surplus is the net gain to an individual seller from selling a good. It is equal to the difference between the price received and the seller’s cost.
The demand curve for good is determined by each potential consumer’s willingness to pay. When the price of a good rises, producer surplus increases through two channels: the gains of those who would have supplied the good at the original price and the gains of those who are induced to supply the good by the higher price. A fall in the price of a good similarly leads to a fall in producer surplus. The total surplus generated in a market is the total net gain to consumers and producers from trading in the market. It is the sum of the producer and the consumer surplus.
Total surplus measures the gains from trade in a market. Markets are efficient except under some well-defined conditions. We can demonstrate the efficiency of a market by considering what hap- pens to total surplus if we start from the equilibrium and reallocate consumption, reallocate sales, or change the quantity traded. Any outcome other than the market equilibrium reduces total surplus, which means that the market equilibrium is efficient. Because society cares about equity, government intervention in a mar- ket that reduces efficiency while increasing equity can be justified. Property rights are the rights of owners of valuable items, whether resources or goods, to dispose of those items as they choose. An economic signal is any piece of information that helps people make better economic decisions. A market or an economy is inefficient if there are missed opportunities: some people could be made better off without making other people worse off. Market failure occurs when a market fails to be efficient. In a market economy, market share interrelated. When each and every market in an economy is efficient, the economy as a whole is efficient. But in the real world, some markets in a market economy will almost certainly fail to be efficient. A system of property right sand the operation of prices as economic signals are two key factors that enable a market to be efficient. But under conditions in which property rights are incomplete or prices give inaccurate economic signals, markets can fail. Under certain conditions, market failure occurs and the market is inefficient: gains to trade are unrealized. The three principal ways in which markets fail are the prevention of mutually beneficial transactions caused by one party’s attempt to capture more surplus, side effects that aren’t properly account- ed for, and problems in the nature of the goods themselves.
Elasticity The price elasticity of demand is the ratio of the percent change in the quantity demanded to the percent change in the price as we move along the demand curve (dropping the minus sign). The midpoint method is a technique for calculating the percent change. In this approach, we calculate changes in a variable compared with the average, or midpoint, of the starting and final values. Demand is perfectly inelastic when the quantity demanded does not respond at all to changes in the price. When demand is perfectly inelastic, the demand curve is a vertical line. Demand is perfectly elastic when any price increase will cause the quantity demanded to drop to zero. When demand is perfectly elastic, the demand curve is a horizontal line. Demand is elastic if the price elasticity of demand is greater than 1, inelastic if the price elasticity of demand is less than 1, and unit-elastic if the price elasticity of demand is exactly 1. The total revenue is the total value of sales of a good or service. It is equal to the price multiplied by the quantity sold. The cross-price elasticity of demand between two goods measures the effect of the change in one good’s price on the quantity demanded of the other good. It is equal to the percent change in the quantity demanded of one good divided by the percent change in the other good’s price. The income elasticity of demand is the percent change in the quantity of a good demanded when a consumer’s income changes divided by the percent change in the consumer’s income. The price elasticity of supply is a measure of the responsiveness of the quantity of a good supplied to the price of that good. It is the ratio of the percent change in the quantity supplied to the percent change in the price as we move along the supply curve. There is perfectly inelastic supply when the price elasticity of supply is zero, so that changes in the price of the good have no effect on the quantity supplied. A perfectly inelastic supply curve is a vertical line. There is perfectly elastic supply when even a tiny increase or reduction in the price will lead to very large changes in the quantity supplied, so that the price elasticity of supply is infinite. A perfectly elastic supply curve is a horizontal line.
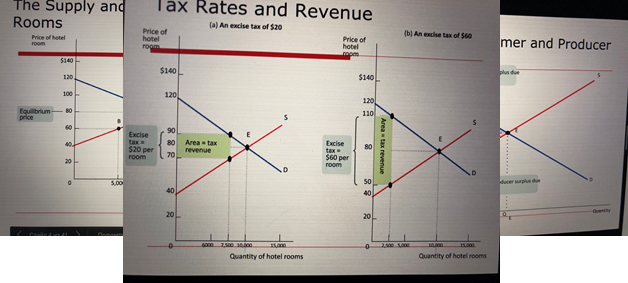
Taxes Supply curve shifts upwards by the amount of the tax Demand curve shifts downwards by the amount of the tax So there is no real difference who pays the tax, price change will be same The incidence of a tax is a measure of who really pays it
Tax revenue = $40 per room x 5,000 rooms = 200.000 The revenue collected by an excise tax is equal to the area of the rectangle choose height is the tax wedge between the supply and demand curve and choose width is the quantity transacted under the tax The deadweight loss is caused by the tax represents the total surplus lost to society because of the tax - that is the amount of surplus that would have been generated by transactions that now do not take place. The administrative costs of a tax are the resources used by govern to collect the tax, and by taxpayers to pay it, over and above the amount of tax The total inefficiency, caused by tax is the sum of deadweight loss and its administrative costs. Govern should choose to tac only demand only on those goods for which dam and sup or both is inelastic (cigarets) Income Tax: a tax that depends on the income of an individual or a family from wages and investments Payroll tax: a tax that depends on the earnings an ampler pays to an employee Sales Tax: a tax that depends on on the value of goods sold (excise tax) Profit tax: a tax that depends on a firms profits Property tax: a tax that depends on the value of property, such as the value of a home
Wealth tax: a tax that depends on the individuals wealth A progressive tax takes a large share of the income of high-income taxpayers than low-income taxpayers A regressive tax takes a smaller share of the income of high-income taxpayers than low-income taxpayer. The marginal tax rate is the percentage of an increase in income that is taxed away Excise taxes - takes on the purchase or sale of a good. Raise the price paid by consumers and reduce the price received by producers. The incident of the tax - how the burden of the tax is divided between consumers and producers - does not depend on who officially pays the tax.
International trade Goods and services purchased from other countries are imports; goods and services sold to other countries are exports. Globalization is the phenomenon of growing economic linkages among countries. The Ricardian model of international trade analyzes international trade under the assumption that opportunity costs are constant. Autarky is a situation in which a country does not trade with other countries. The factor intensity of production of a good is a measure of which factor is used in relatively greater quantities than other factors in production. According to the Heckscher–Ohlin model, a country has a comparative advantage in a good whose production is intensive in the factors that are abundantly available in that country.
The domestic demand curve shows how the quantity of a good demanded by domestic consumers depends on the price of that good. The domestic supply curve shows how the quantity of a good supplied by domestic producers depends on the price of that good. The world price of a good is the price at which that good can be bought or sold abroad.
Exporting industries produce goods and services that are sold abroad. Import-competing industries produce goods and services that are also imported. An economy has free trade when the government does not attempt either to reduce or to increase the levels of exports and imports that occur naturally as a result of supply and demand.
Policies that limit imports are known as trade protection or simply as protection. A tariff is a tax levied on imports.
An import quota is a legal limit on the quantity of a good that can be imported. International trade agreements are treaties in which a country promises to engage in less trade protection against the exports of other countries in return for a promise by other countries to do the same for its own exports. The North American Free Trade Agreement, or NAFTA, is a trade agreement among the United States, Canada, and Mexico. The European Union, or EU, is a customs union among 27 European nations. The World Trade Organization, or WTO, oversees international trade agreements and rules on disputes between countries over those agreements. Offshore outsourcing takes place when businesses hire people in another country to perform various tasks. 1. International trade is of growing importance to the United States and of even greater importance to most other countries. International trade, like trade among individuals, arises from comparative advantage: the opportunity cost of producing an additional unit of a good is lower in some countries than in others. Goods and services purchased abroad are imports; those sold abroad are exports. Foreign trade, like other economic linkages between countries, has been growing rapidly, a phenomenon called globalization. 2. The Ricardian model of international trade assumes that opportunity costs are constant. It shows that there are gains from trade: two countries are better off with trade than in autarky. 3. The Heckscher–Ohlin model shows how differences in factor endowments determine comparative advantage. 4. The domestic demand curve and the domestic supply curve determine the price of a good in autarky. When international trade occurs, the domestic price is driven to equality with the world price, the price at which the good is bought and sold abroad. 5. If the world price is below the autarky price, a good is imported. This leads to an increase in consumer surplus, a fall in producer surplus, and a gain in total surplus. If the world price is above the autarky price, a good is exported. This leads to an increase in producer surplus, a fall in consumer surplus, and a gain in total surplus.
6. International trade leads to expansion in exporting industries and contraction in import-competing industries. 7. Most economists advocate free trade, but in practice many governments engage in trade protection. 8. A tariff is a tax levied on imports. An import quota is a legal limit on the quantity of a good that can be imported. 9. Although several popular arguments have been made in favor of trade protection, in practice the main reason for protection is probably political: import-competing industries are well organized and well informed about how they gain from trade protection, while consumers are unaware of the costs they pay. 10. Many concerns have been raised about the effects of globalization.
Making decisions All economic decisions involve the allocation of scarce resources. Some decisions are “either–or” decisions, in which the question is whether or not to do something. Other decisions are “how much” decisions, in which the question is how much of a resource to put into a given activity. The cost of using a resource for a particular activity is the opportunity cost of that resource. Some opportunity costs are explicit costs; they involve a direct payment of cash. Other opportunity costs, however, are implicit costs; they involve no outlay of money but represent the inflows of cash that are forgone. Both explicit and implicit costs should be taken into account in making decisions. Companies use capital and their owners’ time. So companies should base decisions on economic profit, which takes into account implicit costs such as the opportunity cost of the owners’ time and the implicit cost of capital. The accounting profit, which companies calculate for the purposes of taxes and public reporting, is often considerably larger than the economic profit because it includes only explicit costs and depreciation, not implicit costs. A “how much” decision is made using marginal analysis, which involves comparing the benefit to the cost of doing an additional unit of an activity. The marginal cost of producing a good or service is the additional cost incurred by producing one more unit of that good or service. The marginal benefit of producing a good or service is the additional benefit earned by producing one more unit. The marginal cost curve is the graphical illustration of marginal cost, and the marginal benefit curve is the graphical illustration of marginal benefit. In the case of constant marginal cost, each additional unit costs the same amount to produce as the unit before; this is represented by a horizontal marginal cost curve. However, marginal cost and marginal benefit typically depend on how much of the activity has already been done. With increasing marginal cost, each unit costs more to produce than the unit before and is represented by an upward-sloping marginal cost curve. In the case of decreasing marginal benefit, each additional unit produces a smaller benefit than the unit before and is represented by a downward-sloping marginal benefit curve. The optimal quantity is the quantity that generates the maximum possible total net gain. According to the principle of marginal analysis, the optimal quantity is the quantity at which marginal benefit is equal to marginal cost. It is the quantity at which the marginal cost curve and the marginal benefit curve intersect. A cost that has already been incurred and that is nonrecoverable is a sunk cost. Sunk costs should be ignored in decisions about future actions because they have no effect on future benefits and costs. In order to evaluate a project in which costs or benefits are realized in the future, you must first transform them into their present values using the interest rate, r. The present value of $1 realized one year from now is $1/(1 + r), the amount of money you must lend out today to have $1 one year from now. Once this transformation is done, you should choose the project with the highest net present value.
The rational consumer
Consumers maximize a measure of satisfaction called utility. Each consumer has a utility function that determines the level of total utility generated by his or her consumption bundle, the goods and services that are consumed. We measure utility in hypothetical units called utils.
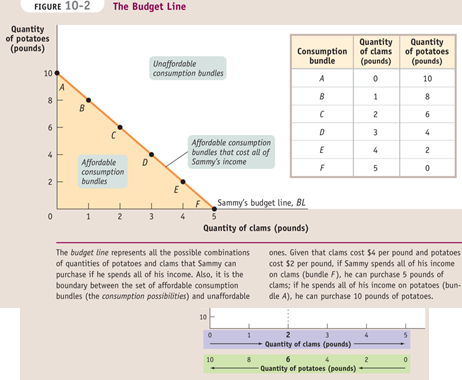
A good’s or service’s marginal utility is the additional utility generated by consuming one more unit of the good or service. We usually assume that the principle of diminishing marginal utility holds: consumption of another unit of a good or service yields less additional utility than the previous unit. As a result, the marginal utility curve slopes downward. A budget constraint limits a consumer’s spending to no more than his or her income. It defines the consumer’s consumption possibilities, the set of all affordable consumption bundles. A consumer who spends all of his or her income will choose a consumption bundle on the budget line. An individual chooses the consumption bundle that maximizes total utility, the optimal consumption bundle.
The substitution effect of a change in the price of a good is the change in the quantity of that good consumed as the consumer substitutes the good that has become relatively cheaper in place of the good that has become relatively more expensive. The income effect of a change in the price of a good is the change in the quantity of that good consumed that results from a change in the consumer’s purchasing power due to the change in the price of the good.
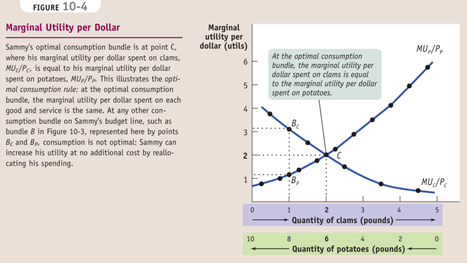
We use marginal analysis to find the optimal consumption bundle by analyzing how to allocate the marginal dollar. The optimal consumption rule says that at the optimal consumption bundle the marginal utility per dollar spent on each good and service – the marginal utility of a good divided by its price – is the same.
Changes in the price of a good affect the quantity consumed in two possible ways: the substitution effect and the income effect. Most goods absorb only a small share of a consumer’s spending; for these goods, only the substitution effect – buying less of the good that has become relatively more expensive and more of the good that has become relatively cheaper–is significant. It causes the individual and the market demand curves to slope downward. When a good absorbs a large fraction of spending, the income effect is also significant: an increase in a good’s price makes a consumer poorer, but a decrease in price makes a consumer richer. This change in purchasing power makes consumers demand more or less of a good, depending on whether the good is normal or inferior. For normal goods, the substitution and income effects reinforce each other. For inferior goods, however, they work in opposite directions.
MONOPOLY ➤The significance of monopoly, where a single monopolist is the only producer of a good ➤ How a monopolist determines its profit-maximizing output and price ➤ The difference between monopoly and perfect competition, and the effects of that difference on society’s welfare ➤ How policy makers address the problems posed by monopoly ➤ What price discrimination is, and why it is so prevalent when producers have market power In order to develop principles and make predictions about markets and how producers will behave in them, economists have developed four principal models of market structure: 1. 2. monopoly 3. oligopoly 4. monopolistic competition.
The Meaning of Monopoly A monopolist is a firm that is the only producer of a good that has no close substitutes. An industry controlled by a monopolist is known as a monopoly. Market power is the ability of a firm to raise prices.
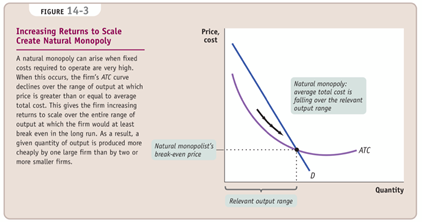
To earn economic profits, a monopolist must be protected by a barrier to entry—something that prevents other firms from entering the industry. 1. Control of a Scarce Resource or Input A monopolist that controls a resource or input crucial to an industry can prevent other firms from entering its market. 2. Local gas supply is an industry in which average total cost falls as output increases – increasing returns to scale. There we learned that when average total cost falls as output increases, firms tend to grow larger. In an industry characterized by increasing returns to scale, larger companies are more profitable and drive out smaller ones. For the same reason, established companies have a cost advantage over any potential entrant—a potent barrier to entry. So increasing returns to scale can both give rise to and sustain monopoly.
A natural monopoly exists when increasing returns to scale provide a large cost advantage to a single firm that produces all of an industry’s output. 3. Technological Superiority A firm that maintains a consistent technological advantage over potential competitors can establish itself as a monopolist. But technological superiority is typically not a barrier to entry over the longer term: over time competitors will invest in upgrad- ing their technology to match that of the technology leader. however, that in certain high-tech industries, technological superiority is not a guarantee of success against competitors. Some high-tech industries are characterized by network externalities, a condition that arises when the value of a good to the consumer rises as the number of people who also use the good rises. In these industries, the firm possessing the largest network—the largest number of consumers currently using its product—has an advantage over its competitors in attracting new customers, an advantage that may allow it to become a monopolist. 4. The most important legally created monopolies today arise from patents and copy- rights. A patent gives an inventor a temporary monopoly in the use or sale of an invention. A copyright gives the creator of a liter- ary or artistic work sole rights to profit from that work. If inventors are not protected by patents, they would gain little reward from their efforts: as soon as a valuable invention was made public, others would copy it and sell products based on it. And if inventors could not expect to profit from their inventions, then there would be no incentive to incur the costs of invention in the first place. So the law gives a temporary monopoly through imposing temporary property rights that encourage invention and creation
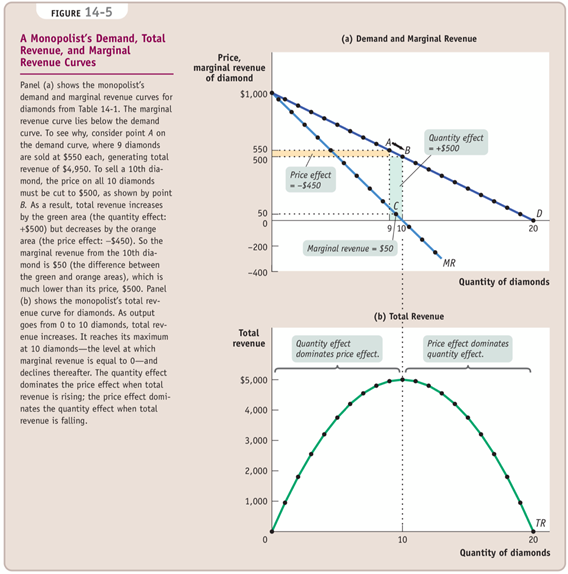
Why is the marginal revenue from that 10th diamond less than the price? It is less than the price because an increase in production by a monopolist has two opposing effects on revenue: · A quantity effect. One more unit is sold, increasing total revenue by the price at which the unit is sold. · A price effect. In order to sell that last unit, the monopolist must cut the market price on all units sold. This decreases total revenue.
➤ Due to the price effect of an increase in output, the marginal revenue curve of a firm with market power always lies below its demand curve. So a profit-maximizing monopolist chooses the output level at which marginal cost is equal to marginal revenue—not to price. ➤ as a result,the monopolists produce less and sells its output at a higher price than a perfectly competitive industry would. It earns a profit in the short run and the long run.
To emphasize how the quantity and price effects offset each other for a firm with market power, notice that it is hill-shaped total revenue curve. This reflects the fact that at low levels of output, the quantity effect is stronger than the price effect: as the monopolist sells more, it has to lower the price on only very few units, so the price effect is small. As output rises beyond 10 diamonds, total revenue actually falls. This reflects the fact that at high levels of output, the price effect is stronger than the quantity effect: as the monopolist sells more, it now has to lower the price on many units of output, making the price effect very large.
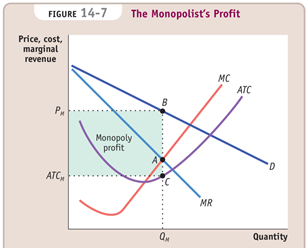
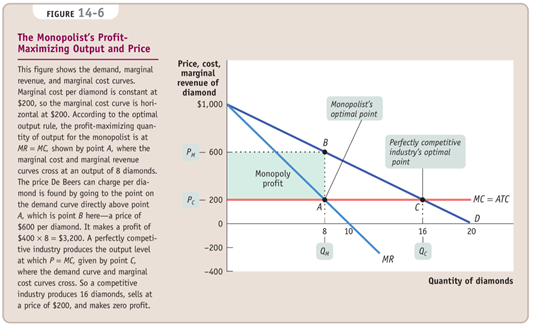
The Monopolist’s Profit-Maximizing Output and Price P > MR = MC at the monopolist’s profit-maximizing quantity of output So, just as we suggested earlier, we see that compared with a competitive industry, a monopolist does the following: ■ Produces a smaller quantity: QM < QC ■ Charges a higher price: PM > PC ■ Earns a profit
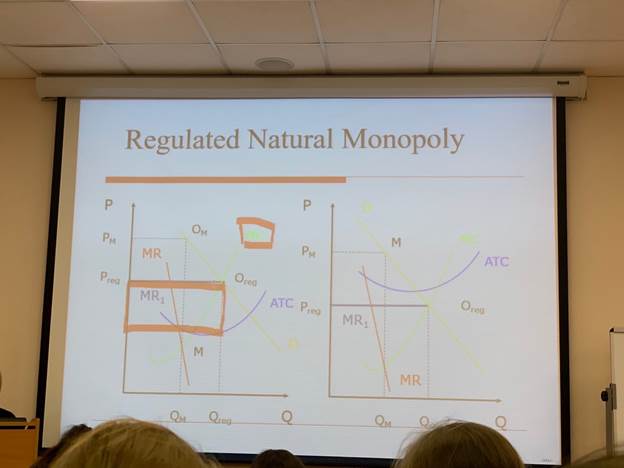
Preventing Monopoly Policy toward monopoly depends crucially on whether or not the industry in question is a natural monopoly, one in which increasing returns to scale ensure that a bigger producer has lower average total cost. If the industry is not a natural monopoly, the best policy is to prevent monopoly from arising or break it up if it already exists. The government policies used to prevent or eliminate monopolies are known as antitrust policy
Dealing with Natural Monopoly Breaking up a monopoly that isn’t natural is clearly a good idea: the gains to consumers outweigh the loss to the producer. But it’s not so clear whether a natural monopoly, one in which large producers have lower average total costs than small producers, should be broken up, because this would raise average total cost. Yet even in the case of a natural monopoly, a profit-maximizing monopolist acts in a way that causes inefficiency—it charges consumers a price that is higher than marginal cost and, by doing so, prevents some potentially beneficial transactions. Also, it can seem unfair that a firm that has managed to establish a monopoly position earns a large profit at the expense of consumers Public Ownership In many countries, the preferred answer to the problem of natural monopoly has been public ownership. Instead of allowing a private monopolist to control an industry, the government establishes a public agency to provide the good and protect consumers’ interests. Regulation In the United States, the more common answer has been to leave the industry in private hands but subject it to regulation. In particular, most local utilities are covered by price regulation that limits the prices they can charge.
Price Discrimination
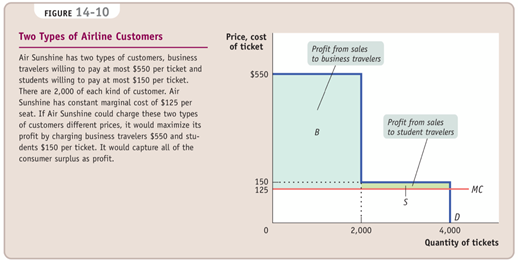
Up to this point, we have considered only the case of a single-price monopolist, one that charges all consumers the same price. As the term suggests, not all monopolists do this. In fact, many if not most monopolists find that they can increase their profits by charging different customers different prices for the same good: they engage in price discrimination.
The important point is that the two groups of consumers differ in their sensitivity to price—that a high price has a larger effect in discouraging purchases by students than by business travelers. As long as different groups of customers respond differently to the price, a monopolist will find that it can capture more consumer surplus and increase its prof- it by charging them different prices.
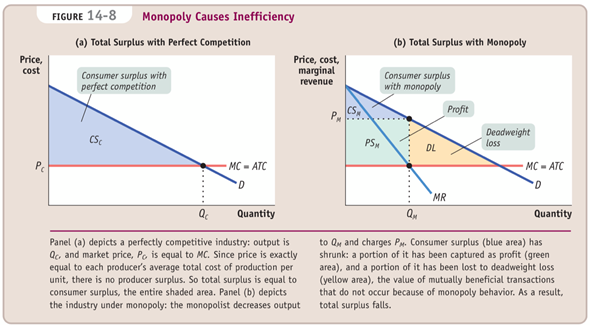
1. There are four main types of market structure based on the number of firms in the industry and product differentiation: perfect competition, monopoly, oligopoly, and monopolistic competition. 2. A monopolist is a producer who is the sole supplier of a good without close substitutes. An industry controlled by a monopolist is a monopoly. 3. The key difference between a monopoly and a perfectly competitive industry is that a single perfectly competitive firm faces a horizontal demand curve but a monopolist faces a downward-sloping demand curve. This gives the monopolist market power, the ability to raise the market price by reducing output compared to a perfectly competitive firm. 4. To persist, a monopoly must be protected by a barrier to entry. This can take the form of control of a natural resource or input, increasing returns to scale that give rise to natural monopoly, technological superiority, or government rules that prevent entry by other firms, such as patents or copyrights. 5. The marginal revenue of a monopolist is composed of a quantity effect (the price received from the additional unit) and a price effect (the reduction in the price at which all units are sold). Because of the price effect, a monopolist’s marginal revenue is always less than the market price, and the marginal revenue curve lies below the demand curve. 6. At the monopolist’s profit-maximizing output level, marginal cost equals marginal revenue, which is less than market price. At the perfectly competitive firm’s profit- maximizing output level, marginal cost equals the market price. So in comparison to perfectly competitive industries, monopolies produce less, charge higher prices, and earn profits in both the short run and the long run. 7. A monopoly creates deadweight losses by charging a price above marginal cost: the loss in consumer surplus exceeds the monopolist’s profit. Thus monopolies are a source of market failure and should be prevented or bro- ken up, except in the case of natural monopolies. 8. Natural monopolies can still cause deadweight losses. To limit these losses, governments sometimes impose public ownership and at other times impose price regulation. A price ceiling on a monopolist, as opposed to a perfectly competitive industry, need not cause shortages and can increase total surplus. 9. Not all monopolists are single-price monopolists. Monopolists, as well as oligopolists and monopolistic competitors, often engage in price discrimination to make higher profits, using various techniques to differentiate consumers based on their sensitivity to price and charging those with less elastic demand higher prices. A monopolist that achieves perfect price discrimination charges each consumer a price equal to his or her willingness to pay and captures the total surplus in the mar- ket. Although perfect price discrimination creates no inefficiency, it is practically impossible to implement.
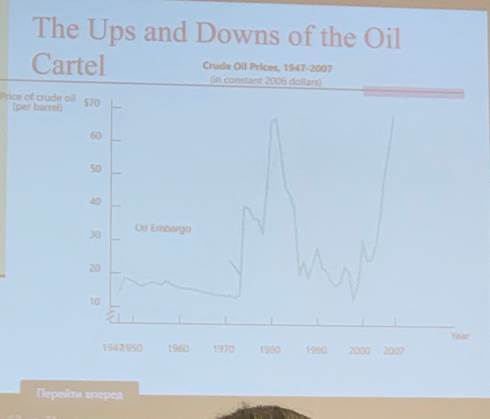
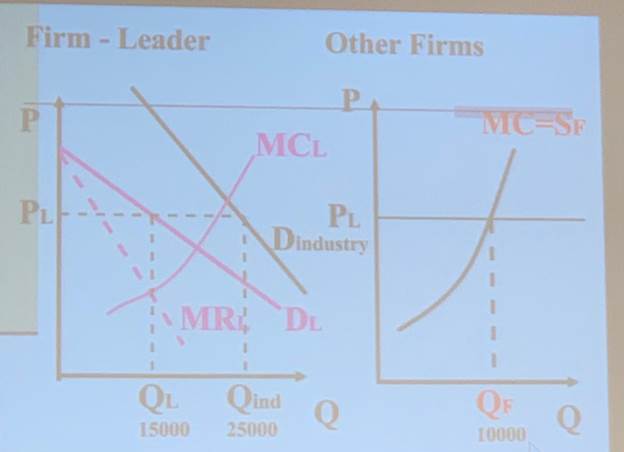
OLIGOPOLY An oligopoly is an industry with only a small number of producers. A producer in such an industry is known as an oligopolist. When no one firm has a monopoly, but producers nonetheless realize that they can affect market prices, an industry is characterized by imperfect competition An oligopoly consisting of only two firms is a duopoly. Each firm is known as a duopolist. Sellers engage in collusion when they cooperate to raise their joint profits. A cartel is an agreement among several producers to obey output restrictions in order to increase their joint profits. When firms ignore the effects of their actions on each others’ profits, they engage in noncooperative behavior When a firm’s decision significantly affects the profits of other firms in the industry, the firms are in a situation of interdependence. The study of behavior in situations of interdependence is known as game theory. The reward received by a player in a game, such as the profit earned by an oligopolist, is that player’s payoff. A payoff matrix shows how the payoff to each of the participants in a two player game depends on the actions of both. Such a matrix helps us analyze situations of interdependence.
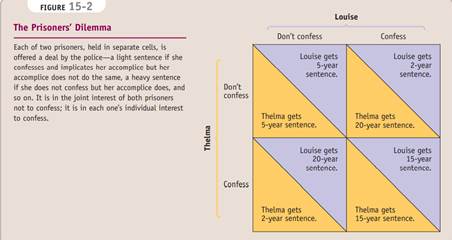
The particular situation shown here is a version of a famous—and seemingly paradoxical—case of interdependence that appears in many contexts. Known as the prisoners’ dilemma, it is a type of game in which the payoff matrix implies the following: ■ Each player has an incentive, regardless of what the other player does, to cheat—to take an action that benefits it at the other’s expense. ■ When both players cheat, both are worse off than they would have been if neither had cheated.
An action is a dominant strategy when it is a player’s best action regardless of the action taken by the other player. A Nash equilibrium, also known as a noncooperative equilibrium, is the result when each player in a game chooses the action that maximizes his or her payoff given the actions of other players, ignoring the effects of his or her action on the payoffs received by those other players. A firm engages in strategic behavior when it attempts to influence the future behavior of other firms. A strategy of tit for tat involves playing cooperatively at first, then doing whatever the other player did in the previous period. The payoff to ADM of each of these strategies would depend on which strategy Ajinomoto chooses. Consider the four possibilities.
1. If ADM plays “tit for tat” and so does Ajinomoto, both firms will make a profit of $180 million each year. 2. If ADM plays “always cheat” but Ajinomoto plays “tit for tat,” ADM makes a profit of $200 million the first year but only $160 million per year thereafter. 3. If ADM plays “tit for tat” but Ajinomoto plays “always cheat,” ADM makes a profit of only $150 million in the first year but $160 million per year thereafter. 4. If ADM plays “always cheat” and Ajinomoto does the same, both firms will make a profit of $160 million each year.
When firms limit production and raise prices in a way that raises each others’ profits, even though they have not made any formal agreement, they are engaged in tacit collusion.
An oligopolist who believes she will lose a substantial number of sales if she reduces output and increases her price but will gain only a few additional sales if she increases output and lowers her price, away from the tacit collusion outcome, faces a kinked demand curve — very flat above the kink and very steep below the kink.
Antitrust policy are efforts undertaken by the government to prevent oligopolistic industries from becoming or behaving like monopolies Although tacit collusion is common, it rarely allows an industry to push prices all the way up to their monopoly level; collusion is usually far from perfect. A variety of factors make it hard for an industry to coordinate on high prices. · Large Numbers · Complex Products and Pricing Schemes · Differences in Interests · Bargaining Power of Buyers
A price war occurs when tacit collusion breaks down and prices collapse. Product differentiation is an attempt by a firm to convince buyers that its product is different from the products of other firms in the industry. In price leadership, one firm sets its price first, and other firms then follow. Firms that have a tacit understanding not to compete on price often engage in intense nonprice competition, using advertising and other means to try to increase their sales.
1. Many industries are oligopolies: there are only a few sellers. In particular, a duopoly has only two sellers. Oligopolies exist for more or less the same reasons that monopolies exist, but in weaker form. They are character- ized by imperfect competition: firms compete but pos- sess market power. 2. Predicting the behavior of oligopolists poses something of a puzzle. The firms in an oligopoly could maximize their combined profits by acting as a cartel, setting out- put levels for each firm as if they were a single monopo- list; to the extent that firms manage to do this, they engage in collusion. But each individual firm has an incentive to produce more than it would in such an arrangement—to engage in noncooperative behavior. Informal collusion is likely to be easier to achieve in industries in which firms face capacity constraints. 3. The situation of interdependence, in which each firm’s profit depends noticeably on what other firms do, is the subject of game theory. In the case of a game with two players, the payoff of each player depends both on its own actions and on the actions of the other; this inter- dependence can be represented as a payoff matrix. Depending on the structure of payoffs in the payoff matrix, a player may have a dominant strategy—an action that is always the best regardless of the other play- er’s actions. 4. Duopolists face a particular type of game known as a prisoners’ dilemma; if each acts independently in its own interest, the resulting Nash equilibrium or nonco- operative equilibrium will be bad for both. However, firms that expect to play a game repeatedly tend to engage in strategic behavior, trying to influence each other’s future actions. A particular strategy that seems to work well in such situations is tit for tat, which often leads to tacit collusion. 5. The kinked demand curve illustrates how an oligopolist that faces unique changes in its marginal cost within a certain range may choose not to adjust its output and price in order to avoid a breakdown in tacit collusion. 6. In order to limit the ability of oligopolists to collude and act like monopolists, most governments pursue an antitrust policy designed to make collusion more diffi- cult. In practice, however, tacit collusion is widespread. 7. A variety of factors make tacit collusion difficult: large numbers of firms, complex products and pricing, differ- ences in interests, and bargaining power of buyers. When tacit collusion breaks down, there is a price war. Oligopolists try to avoid price wars in various ways, such as through product differentiation and through price leadership, in which one firm sets prices for the indus- try. Another is through nonprice competition, like advertising.
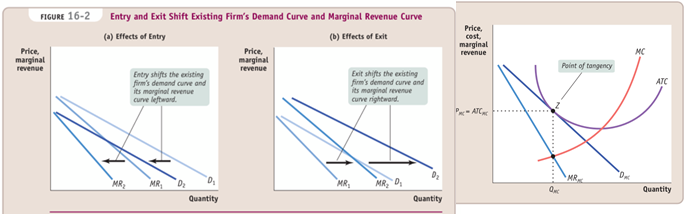
MONOPOLISTIC COMPETITION AND PRODUCT DIFFERENTIATION Monopolistic competition is a market structure in which · there are many competing producers in an industry, · each producer sells a differentiated product, · there is free entry into and exit from the industry in the long run. Product differentiation plays an even more crucial role in monopolistically competitive industries. Why? Tacit collusion is virtually impossible when there are many producers. Hence, product differentiation is the only way monopolistically competitive firms can acquire some market power. How do firms in the same industry- such as fast-food vendors, gas stations, or chocolate companies- differentiate their products? Is the difference mainly in the minds of consumers or in the products themselves? There are 3 important forms of product differentiation: · Differentiation by Style or Type – sedans vs SUVs · Differentiation by Location – dry cleaner near home vs cheaper dry cleaner far away · Differentiation by Quality – ordinary chocolate vs gourmet chocolate Whatever form it takes, however, there are two important features of industries with differentiated products: · Competition among sellers means that even though sellers of differentiated products are not offering identical goods, they are to some extent competing for a limited market. If more businesses enter the market, each will find that it sells less quantity at any given price. · Value in diversity. Benefits to consumers from a greater diversity of available products. As the term monopolistic competition suggests, this market structure combines some features typical of monopoly with others typical of perfect competition: · Because each firm is offering a distinct product, it is in a way like a monopolist: it faces a downward-sloping demand curve and has some market power—the ability within limits to determine the price of its product. · However, unlike a pure monopolist, a monopolistically competitive firm does face competition: the amount of its product it can sell depends on the prices and products offered by other firms in the industry. The following figure shows two possible situations that a typical firm in a monopolistically competitive industry might face in the short run. · In each case, the firm looks like any monopolist: it faces a downward-sloping demand curve, which implies a downward-sloping marginal revenue curve. ·
We assume that every firm has an upward-sloping marginal cost curve but that it also faces some fixed costs, so that its average total cost curve is U-shaped.
If existing firms are profitable, entry will occur and shift each existing firm’s demand curve left- ward. If existing firms are unprofitable, each remaining firm’s demand curve shifts rightward as some firms exit the industry.
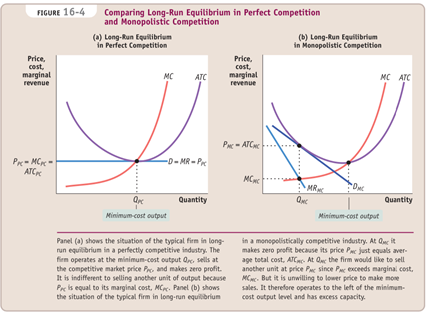
In the long-run equilibrium of a monopolistically competitive industry, there are many firms, all earning zero profit.
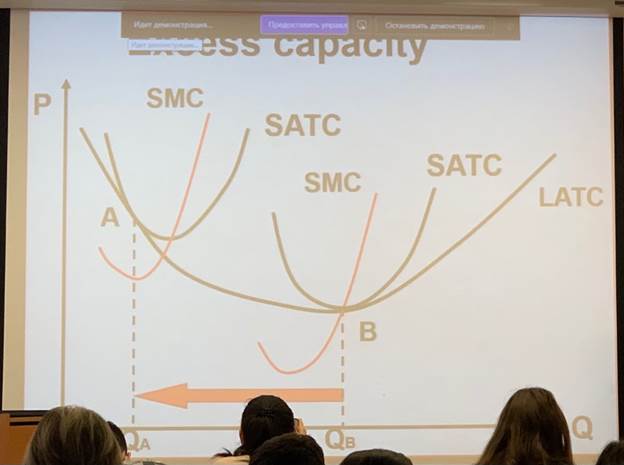
Price exceeds marginal cost so some mutually beneficial trades are exploited. Firms in a monopolistically competitive industry have excess capacity: they produce less than the output at which average total cost is minimized. Price exceeds marginal cost, so some mutually beneficial trades are unexploited. The higher price consumers pay because of excess capacity is offset to some extent by the value they receive from greater diversity.
No discussion of product differentiation is complete without spending at least a bit of time on the two related issues: · advertising · brand names. In industries with product differentiation, firms advertise in order to increase the demand for their products. Advertising is not a waste of resources when it gives consumers useful information about products. Advertising that simply touts a product is harder to explain. Either consumers are irrational, or expensive advertising communicates that the firm’s products are of high quality.
Some firms create brand names. A brand name is a name owned by a particular firm that distinguishes its products from those of other firms. As with advertising, the economic value of brand names can be ambiguous. They convey real information when they assure consumers of the quality of a product.
1.Monopolistic competition is a market structure in which there are many competing producers, each produc- ing a differentiated product, and there is free entry and exit in the long run. Product differentiation takes three main forms: by style or type, by location, or by quality. Products of competing sellers are considered imperfect substitutes, and each firm has its own downward-sloping demand curve and marginal revenue curve. 2. Short-run profits will attract entry of new firms in the long run. This reduces the quantity each existing produc- er sells at any given price and shifts its demand curve to the left. Short-run losses will induce exit by some firms in the long run. This shifts the demand curve of each remaining firm to the right. 3. In the long run, a monopolistically competitive industry is in zero-profit equilibrium: at its profit-maximizing quantity, the demand curve for each existing firm is tan- gent to its average total cost curve. There are zero profits in the industry and no entry or exit. 4. In long-run equilibrium, firms in a monopolistically competitive industry sell at a price greater than marginal cost. They also have excess capacity because they pro- duce less than the minimum-cost output; as a result, they have higher costs than firms in a perfectly competi- tive industry. Whether or not monopolistic competition is inefficient is ambiguous because consumers value the diversity of products that it creates. 5. A monopolistically competitive firm will always prefer to make an additional sale at the going price, so it will engage in advertising to increase demand for its product and enhance its market power. Advertising and brand names that provide useful information to consumers are economically valuable. But they are economically waste- ful when their only purpose is to create market power. In reality, advertising and brand names are likely to be some of both: economically valuable and economically wasteful.
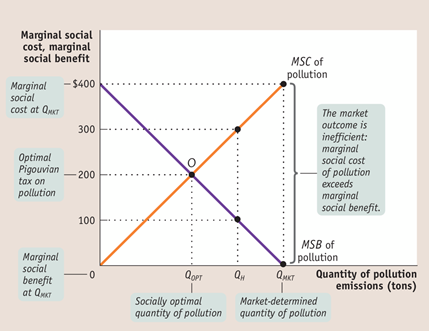
EXTERNALITIES Pollution is a bad thing. · Yet most pollution is a side effect of activities that provide us with good things. · our air is polluted by power plants generating the electricity that lights our cities, and our rivers are damaged by fertilizer runoff from farms that grow our food. Pollution is a side effect of useful activities, so the optimal quantity of pollution isn’t zero. The marginal social cost of pollution is the additional cost imposed on society as a whole by an additional unit of pollution.
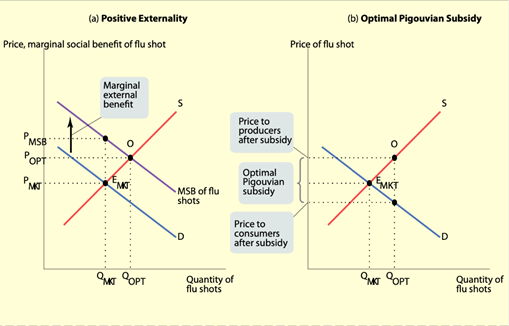
The socially optimal quantity of pollution is the quantity of pollution that society would choose if all the costs and benefits of pollution were fully accounted for. An external cost is an uncompensated cost that an individual or firm imposes on others. An external benefit is a benefit that an individual or firm confers on others without receiving compensation.
Pollution is an example of an external cost, or negative externality; in contrast, some activities can give rise to external benefits, or positive externalities. External costs and benefits are known as externalities.
Left to itself, a market economy will typically generate too much pollution because polluters have no incentive to take into account the costs they impose on others.
In an influential 1960 article, the economist Ronald Coase pointed out that, in an ideal world, the private sector could indeed deal with all externalities. According to the Coase theorem, even in the presence of externalities an economy can always reach an efficient solution provided that the transaction costs—the costs to individuals of making a deal—are sufficiently low. The costs of making a deal are known as transaction costs.
The implication of Coase’s analysis is that externalities need not lead to inefficiency because individuals have an incentive to find a way to make mutually beneficial deals that lead them to take externalities into account when making decisions. When individuals do take externalities into account, economists say that they internalize the externality. Transaction costs prevent individuals from making efficient deals.
Examples of transaction costs include the following:
Policies Toward Pollution: · Environmental standards are rules that protect the environment by specifying actions by producers and consumers. Generally such standards are inefficient because they are inflexible. · An emissions tax is a tax that depends on the amount of pollution a firm produces. · Tradable emissions permits are licenses to emit limited quantities of pollutants that can be bought and sold by polluters. · Taxes designed to reduce external costs are known as Pigouvian taxes.
The marginal social benefit of a good or activity is equal to the marginal benefit that accrues to consumers plus its marginal external benefit. A Pigouvian subsidy is a payment designed to encourage activities that yield external benefits. A technology spillover is an external benefit that results when knowledge spreads among individuals and firms. The socially optimal quantity can be achieved by an optimal Pigouvian subsidy equal to the marginal external benefit. An industrial policy is a policy that supports industries believed to yield positive externalities.
|
|||||||||||||||||||||||||||||||||||||||||||||
|
|
Последнее изменение этой страницы: 2021-07-19; просмотров: 86; Нарушение авторского права страницы; Мы поможем в написании вашей работы! infopedia.su Все материалы представленные на сайте исключительно с целью ознакомления читателями и не преследуют коммерческих целей или нарушение авторских прав. Обратная связь - 18.217.139.162 (0.495 с.) |


 perfect competition
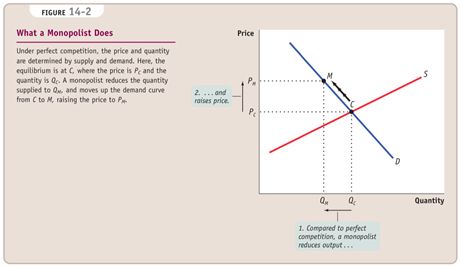


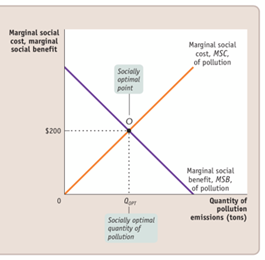 The marginal social benefit of pollution is the additional gain to society as a whole from an additional unit of pollution.