Заглавная страница Избранные статьи Случайная статья Познавательные статьи Новые добавления Обратная связь КАТЕГОРИИ: ТОП 10 на сайте Приготовление дезинфицирующих растворов различной концентрацииТехника нижней прямой подачи мяча. Франко-прусская война (причины и последствия) Организация работы процедурного кабинета Смысловое и механическое запоминание, их место и роль в усвоении знаний Коммуникативные барьеры и пути их преодоления Обработка изделий медицинского назначения многократного применения Образцы текста публицистического стиля Четыре типа изменения баланса Задачи с ответами для Всероссийской олимпиады по праву 
Мы поможем в написании ваших работ! ЗНАЕТЕ ЛИ ВЫ?
Влияние общества на человека
Приготовление дезинфицирующих растворов различной концентрации Практические работы по географии для 6 класса Организация работы процедурного кабинета Изменения в неживой природе осенью Уборка процедурного кабинета Сольфеджио. Все правила по сольфеджио Балочные системы. Определение реакций опор и моментов защемления |
Apple's Financial Position AnalysisСтр 1 из 2Следующая ⇒
Apple's Financial Position Analysis The analysis given below on apple's financial state and activity efficiency is made for the period from 01.01.2014 to 31.12.2015 based on the financial statements data prepared according to International Financial Reporting Standards (IFRS). Structure of the Assets and Liabilities
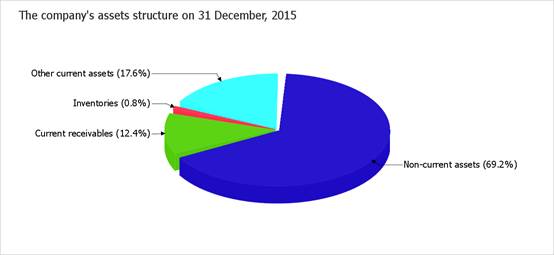
According to the data given in the table, non-current assets were about two thirds of apple's assets (69.2%) on the last day of the period analysed (31.12.2015), while current assets took one third. For the entire period reviewed, it was seen that there was a notable growth in the assets from USD 207,000 million to USD 290,479 million (USD +83,479 million). Despite assets growth, the equity of apple reduced by 3.4% and showed USD 119,355 million (or 41.1% of the total balance) on 31 December, 2015. The total growth of apple's assets value is mainly connected with the growth value of the following assets (amount of change and percentage of this change relative to the total assets growth are shown below): · Investment property – USD 57,850 million (66.6%) · Trade and other current receivables – USD 11,795 million (13.6%) · Cash and cash equivalents – USD 6,861 million (7.9%) · Property, plant and equipment – USD 5,874 million (6.8%) The most significant growth of sources of finance ("Equity and Liabilities") is seen on the following rates (the percentage from total equity and liabilities change is shown in brackets): · Trade and other non-current payables – USD 36,503 million (38.2%) · Trade and other current payables – USD 24,448 million (25.6%) · Other long-term financial liabilities – USD 13,219 million (13.8%) · Other current financial liabilities – USD 12,504 million (13.1%) Total assets of the company did not grow to a greater degree due to a negative change in items such as "Other current financial assets" in assets and "Retained earnings" in the company's sources of finance, which were USD -3,149 million and USD -11,972 million respectively for the entire period analysed. Correlation of basic asset groups is demonstrated in the chart below.
The inventories amounted to USD 2,349 million at the end of the period reviewed. The increase in the inventories was USD 585 million during the period reviewed (31.12.13–31.12.15). During the two years, the current receivables significantly spiked (by USD 11,795 million).
Net Assets (Net Worth)
The net tangible assets appreciably fell to USD 117,793 million (by USD 7,447 million, or by 3.4%) for the period analysed (from 31 December, 2013 to 31 December, 2015). On 31.12.2015, the intangible assets were USD 110,346 million. This value shows the difference between the value of net tangible assets and all net worth.
The positive net worth indicates at least a satisfactory financial condition of the company. It means that some property will belong to their owners even after meeting of all its liabilities. The net worth (net assets) value is used as one of the tools to estimate the company's value (used together with other methods, such as discounted cash flow method, or an estimation based on shareholder's value etc.). But it is a key value in the estimation of the company's financial condition.
Financial Sustainability Analysis Working capital analysis
On 31.12.2015, the working capital equaled USD 8,768 million. The working capital significantly decreased (USD -20,860 million) for the period analysed (31.12.13–31.12.15). The table above shows that working capital exceeds the company's inventories by USD 6,419 million. At the end of the period reviewed, the inventory to working capital ratio equaled 0.27. Such a correlation is deemed to be normal, although it can be achieved through warehouse inventories that are too low, but not through enough of long-term resources of financing in some cases.
Liquidity Analysis Liquidity related ratios are one of the most widespread indicators of a company's solvency. The current ratio shows the capacity of a company to meet current liabilities with all available current assets. Quick ratio describes solvency in the near future. Cash ratio shows if there is enough means for uninterrupted execution of current transactions. The table below demonstrates all three liquidity ratios for apple.
On 31.12.2015, the current ratio was equal to1.10, at the same time the current ratio amounted to 1.67 (i.e. the rate went down by-0.57). The value of the ratio is unacceptable on 31.12.2015. The current ratio kept an atypical value during the whole of the period.
On the last day of the period analysed, the quick ratio amounted to1.48. During the entire period analysed, the quick ratio dropped by-0.52. The value of the quick ratio can be characterised as normal on 31 December, 2015. It means that apple has enough liquid assets (cash and other assets which can be rapidly sold) to meet all their current liabilities. At the end of the period reviewed, the value of the cash ratio equal to 0.26is very good. The cash ratio significantly decreased to 0.32 (by-0.06) during the two years.
Financial Performance Profitability Ratios
The profitability ratios given in the table have positive values as a result of the profitability of apple's activities during the last year. The gross margin amounted to 40.1% for the year 2015. That is 38.6% higher than the level for the year 2014. The profitability calculated by earnings before interest and taxes (Return on sales) is more important from a comparative analyses point of view. The return on sales was 0.31 or 31% per annum for the period 01.01–31.12.2015, while the profit margin was 22.8% per annum.
During the period 01.01–31.12.2015, the return on assets was equal to 44%. During the last two years, it was seen that there was a significant increase in the return on assets of 35%. The most important ratio of business profitability is the return on equity (ROE), which reflects the profitability of investments by the owners. For the year 2015, a return on equity was 46.2% per annum. It is a high rate, but it is influenced not only with factors inside the company, but also the economic environment where the company is located (inflation rate, interest rates, etc). The chart below shows changes of the main rates of return on assets and equity of the company for the entire period reviewed.
Conclusion Key Ratios Summary The most important indicators of apple's financial state and activity results are summarized below by using a qualitative assessment for the period analysed (from 31 December, 2013 to 31 December, 2015). The following indicators describe the apple's financial state from only a good point of view: · the cash ratio is 0.26 at the end of the period (a high cash at hand required for current payments); · high return on equity (46.2% per annum); · return on total assets was during the last year 20.4% per annum; · long-term resources of the financing of the company's activity are enough to form a normal amount of working capital which would cover the available inventories; · During the period from 01.01.2015 to 31.12.2015, earnings before interest and taxes (EBIT) showed USD 72,515 million, at the same time, a positive dynamics compared with the data for the year 2014 (USD +19,032 million) was observed; · the income from financial and operational activities (comprehensive income) was USD 53,394 million during the period 01.01–31.12.2015. The following indicators describe the financial condition of apple relative a positive standard: · the percentage of liabilities in the total balance of apple is 58.9% which is normal for stable activity; · a good relationship between liquid assets (current assets minus inventories) and current liabilities (quick ratio is 1.08); · the company has equity (positive net worth) of USD 119,355 million. The analysis discovered the following negative financial characteristics: · the value of the non-current assets to net worth ratio equal to X.XX can be considered as an unsatisfactory one; · the current ratio (1.11) does not correspond to the normal criteria for this rate (2); · equity reduced during the whole period analysed, while the company's total assets grew. Appendix Apple's Financial Position Analysis The analysis given below on apple's financial state and activity efficiency is made for the period from 01.01.2014 to 31.12.2015 based on the financial statements data prepared according to International Financial Reporting Standards (IFRS).
|
||||||||||||||||||||||||||||||||||||||||||||||||||||||||||||||||||||||||||||||||||||||||||||||||||||||||||||||||||||||||||||||||||||||||||||||||||||||||||||||||||||||||||||||||||||||||||||||||||||||||||||||||||||||||||||||||||||||||||||||||||||||||||||||||||||||||||||||||
|
|
Последнее изменение этой страницы: 2016-04-07; просмотров: 358; Нарушение авторского права страницы; Мы поможем в написании вашей работы! infopedia.su Все материалы представленные на сайте исключительно с целью ознакомления читателями и не преследуют коммерческих целей или нарушение авторских прав. Обратная связь - 13.58.112.1 (0.022 с.) |