Заглавная страница Избранные статьи Случайная статья Познавательные статьи Новые добавления Обратная связь КАТЕГОРИИ: ТОП 10 на сайте Приготовление дезинфицирующих растворов различной концентрацииТехника нижней прямой подачи мяча. Франко-прусская война (причины и последствия) Организация работы процедурного кабинета Смысловое и механическое запоминание, их место и роль в усвоении знаний Коммуникативные барьеры и пути их преодоления Обработка изделий медицинского назначения многократного применения Образцы текста публицистического стиля Четыре типа изменения баланса Задачи с ответами для Всероссийской олимпиады по праву 
Мы поможем в написании ваших работ! ЗНАЕТЕ ЛИ ВЫ?
Влияние общества на человека
Приготовление дезинфицирующих растворов различной концентрации Практические работы по географии для 6 класса Организация работы процедурного кабинета Изменения в неживой природе осенью Уборка процедурного кабинета Сольфеджио. Все правила по сольфеджио Балочные системы. Определение реакций опор и моментов защемления |
Young innovative companies and start-ups⇐ ПредыдущаяСтр 22 из 22
Policy framework conditions are the most influential factor for a sustainable development of innovative young companies and start-ups. Only if such companies can operate in a beneficial environment and manage to establish themselves on the domestic market, they can become powerful enough to again shape those policies, relevant for them. This, on the whole, creates a circle of policy making and intervention. That is why authorities should make focused and sustained efforts to improve the legal environment for start-ups, SMEs and innovative young companies. Some call it the “chicken-egg-problem”, as a lack of innovation infrastructure or intermediaries can prevent new innovative companies from emerging, and at the same time the lack of new innovative young companies can limit the prospects for such infrastructure and intermediaries to be sustainable.227
In 2007 a law was introduced by the Ukrainian government aiming to promote the creation of spin-offs (independent small companies) by universities. Soon after the introduction of this law the economic crisis hit Ukraine in 2008/2009, causing a general cut in state budgets. Another official attempt to support the creation of new innovative companies are joint “business-start-up-centres”, which were launched as a programme by the government back in the 1990s and which ran until 2011.228 The creation of the first business-start-up-centres was stimulated with money from international donors, such as USAID or the
Open Society Foundations by George Soros. In 2003 the “Ukrainian Business Incubators and Innovation Centre Association“ (UBICA) was created. UBICA supported entrepreneurial development programmes with a focus on incubators, technology parks and other relevant infrastructures for innovation (among them, legislative framework for setting up start-up companies). Based on data available online, UBICA was running only from 2003 until 2005 though.229
Innovative companies and SMEs in general face particular difficulties when trying to raise finance, which remains a critical obstacle when starting a business. Support programmes for SMEs are very limited and there were no public interventions targeting start-ups in general in Ukraine until mid 2016. The limited public resources and previous unsuccessful attempts to stimulate innovation by offering financial incentives help in explaining the absence of financial mechanisms to encourage the development of innovative young enterprises. There is clear evidence that SMEs and start-ups in particular, have insufficient access to external financial resources due to the risk aversion of banks and limited presence of business angels and venture capitalists230 – a fact, which, apart from the lacking policy environment, could be seen as the second major problem for initiating the creation of start-ups in Ukraine. Additionally, bureaucracy is a more significant problem than in most transition countries, while bribery and the threat of competitors are lesser concerns for start-ups in Ukraine.231
Despite this hindering policy environment, Ukraine has some entrepreneurial talent with a relatively strong individual risk-taking attitude. The question is, whether the talent available in the country reaches a critical mass to intervene in policy making for better supporting innovative entrepreneurship. One of the sectors where start-ups are most prevalent in Ukraine is the IT sector. As a sector, where mainly young educated people work in and which often has low entry costs, this is a beneficial precondition for the unfolding of entrepreneurial talents.
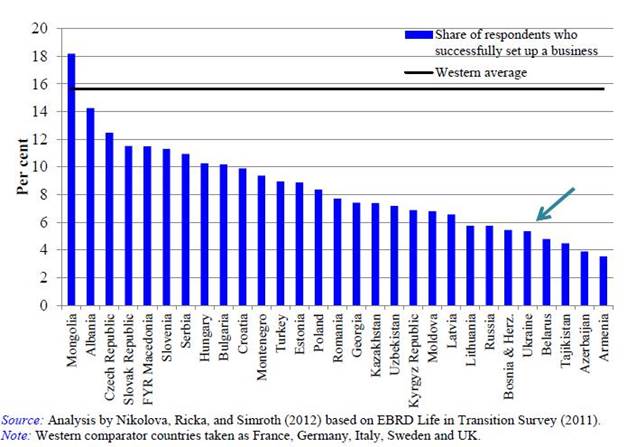
The incidence of successful business start-ups is driven by two factors: the proportion of the population attempting a start-up, and their likelihood of success. While the percentage of individuals starting an enterprise in the region’s transition countries does not differ significantly from advanced economies, the likelihood of success is markedly lower. The result is a generally lower incidence of successful start-ups in transition countries when compared to a Western European average of almost 16%. In Ukraine, only around 5% of all respondents reported having successfully set up a business, ranking 25th among 29
227 UN, Innovation Performance Review Ukraine 2013, p.12
228 Breitfuss, Marinkovic, Machacova et al.: “Identifikation und Analyse der Forschungsprioritдten und der davon abgeleiteten FTE-Programme in Bosnien-Herzegowina, Mazedonien, Serbien, Tьrkei und Ukraine zur Ermittlung von Kooperationspotentialen fьr Forschung Austria Mitglieder“, Joanneum Research & ZSI – Centre for Social Innovation, Wien/Graz, 2011, p.79
229 Ibid., p.82
230 UN, Innovation Performance Review Ukraine 2013, p.80
231 See E. Nikolova, F. Ricka, D. Simroth (2012), Entrepreneurship in the transition region: an analysis based on the Life in Transition Survey, EBRD Working Paper No. 141, London, cited in: UN, Innovation Performance Review Ukraine 2013, p.80
countries.232 Figure 35 below provides details on the share of respondents who successfully set up a business in Ukraine and selected other countries. When interpreting these figures it has to be noted, that the current Ukrainian legal framework facilitates entrepreneurs to register as individuals as opposed to companies, and so actual levels of successful “start-up” may be higher than the numbers would suggest.
Figure 35: Successful business start-ups (share of respondents in %); source = Snapshot from UN Innovation Performance Review Ukraine, 2013
Effective policy actions that would improve this low survival rate of start-ups in Ukraine would contribute to employment, diversification of the industrial structure and stimulation of competition. Regarding venture capital, the UN review on innovation in Ukraine makes some positive statement, in saying that Ukraine has an emerging venture capital scene, which indicates the presence of entrepreneurial opportunities in the country.233 Venture capital is an important ingredient of the innovation system.234 Still, the development of the venture capital industry requires the presence of other financial intermediaries and business services.
It also has to be noted, that a business environment conducive to a thriving market economy also needs to fight corruption and the oligarchic ownership and control structures. “No traditional STI policy initiative can expect to have a decisive impact on private sector R&D if the business environment remains largely hostile to the emergence of new enterprises and market-based challenges to existing power relations”
(UNESCO Science Report 2015, p. 29).
232 UN, Innovation Performance Review Ukraine 2013, p.75
233 Ibid., p.xvii
234 https://www.unido.org/uploads/tx_templavoila/Strategies_for_regional_innovation_systems.pdf: accessed on 3 May 2016.
CITED REFERENCES
BLACK SEA HORIZON (2016): “Analysis of Black Sea relevant data in PATSTAT”, Deliverable within
BLACK SEA HORIZON project, (DRAFT)
Breitfuss, Marinkovic, Machacova et al. (2011): “Identifikation und Analyse der Forschungsprioritдten und der davon abgeleiteten FTE-Programme in Bosnien-Herzegowina, Mazedonien, Serbien, Tьrkei und
Ukraine zur Ermittlung von Kooperationspotentialen fьr Forschung Austria Mitglieder“, Joanneum
Research & ZSI – Centre for Social Innovation, Wien/Graz
Buesel, K. et al. (2015): EU-Ukrainian co-publication analysis including emerging trends.url: http://www.bilat-ukraina.eu/_media/Deliverable_2.20_EU-Ukrainian_co-publication_analysis_including_emerging_trends_final_v07.pdf
Cornell University, INSEAD, and WIPO (2015): “The Global Innovation Index 2015: Effective Innovation Policies for Development”, Fontainebleau, Ithaca, and Geneva
Gryga Vitalii, Rybachuk Victor, Krasovska Olha (2014): Evaluation of R&D Institutions in Ukraine – The New Approach
Koval Olena, Yashenkov Vadym et al. (2012): “Overview of the internationalisation of Ukraine in RTDI including recent trends and developments”, Policy Brief in BILAT-UKR*AINA project
Lampert, D. et al (2015). Co-publication and co-patenting analysis among countries in the
Danube Region. url: http://danube- inco.net/object/document/15167/attach/Deliverable_4_16_Co-publication_and_co-patenting_analysis_among_countries_in_the_Danube_Region__final.pdf
Lubov Semiv, Hvozdovych Yulia (2012): „The intellectual migration of the youth in Ukraine: the backgrounds for brain circulation”, Journal of International Studies, Vol. 5, No. 2
Melnyk Olena, Koval Olena (2015): „Progress Report on monitoring of Ukraine participation in FP7 and
Horizon 2020, Deliverable 2.18 in BILAT-UKR*AINA project
Rathske Erich (2014): “Comparative Analysis of EU MS/AC policies and programmes towards Ukraine”,
Deliverable 1.5 in the frame of BILAT-UKR*AINA project
Schwab Klaus (2015): „The global competitiveness report 2015-2016”, Insight Report by World Economic
Forum
SCImago (2007). SJR — SCImago Journal & Country Rank. Retrieved April 21, 2015, from http://www.scimagojr.com
Self-assessment report (2016): Scientific and technological sphere of Ukraine, MESU
The Science-Metrix Ontology of Science and the Ontology of Scientific Journals are products of Eric Archambault und Olivier H. Beauchesne, Science-Metrix, Montreal, Quebec, Canada. First published 2010-12-01 (v1.00). We thank the developers and translators of this three-level classification system.www.science-metrix.com
UNESCO Institute for Statistics (UIS): What do bibliometric indicators tell us about world scientific output? IN: UIS Bulletin on Science and Technology Statistics, No 2, September 2005 [online available at www.csiic.ca/PDF/UIS_bulletin_sept2005_EN.pdf ]
United Nations Economic Commission for Europe (UNECE) (2013): “Innovation Performance Review Ukraine”, New York and Geneva
Yegorov, Igor (2015): Nauka i Naukovedenie (Science and Science of Science), N.2 (88), p.12-20
Yegorov, Igor (2013): „Erawatch Country Reports 2012: Ukraine“, ERAWATCH Network – Centre for S&T Potential and Science History Studies of the National Academy of Sciences Ukraine
Online sources:
BILAT-UKR*AINA Project: http://www.bilat.eu/235.php?country=UA&programme_type=any&thematic_area=any&textsearch=&submit=Search (16.04.2016)
INCREAST Portal: Country Report Ukraine: http://www.increast.eu/en/139.php (16.4.2016)
UNESCO Science report towards 2030 (2015):
http://unesdoc.unesco.org/images/0023/002354/235406e.pdf (5.4.2016) UNECE:
Law of Ukraine on Scientific and Scientific Technical Activities 2015 (in Ukrainian):
http://zakon3.rada.gov.ua/laws/show/848-19 (10.4.2016)
Law of Ukraine on Innovation (1993/2003). Link:
http://www.wipo.int/wipolex/en/text.jsp?file_id=182883 (EN- summary);
http://zakon5.rada.gov.ua/laws/show/3689-12 (UA) (10.4.2016)
Laws and Decrees of Ukraine related to RTDI (available only in the Ukrainian language): http://zakon5.rada.gov.ua (10.4.2016)
President of Ukraine: http://www.president.gov.ua/en/ (18.4.2016)
Ukrainian Parliament: http://gapp.rada.gov.ua/radatransl/Home/Committees/en (20.4.2016)
Government of Ukraine (EN): http://www.kmu.gov.ua/control/en/publish/article?art_id=247077686&cat_id=247605901 (20.4.2016)
List of Universities in Ukraine: https://study-inukraine.com/Universities-in-Ukraine.html (5.4.2016) List of NCPs and RCPs: http://www.bilat-ukraina.eu/en/393.php#RCP (20.4.2016)
UNECE “Innovation Performance Review: Ukraine”: https://www.unece.org/fileadmin/DAM/ceci/publications/icp7.pdf (15.4.2016)
European Union External Action Service - EU-Ukraine Association Agreement:
http://eeas.europa.eu/top_stories/2012/140912_ukraine_en.htm (29.04.2016)
European Union External Action Service - Fact Sheet: http://eeas.europa.eu/top_stories/pdf/the-eu-non-recognition-policy-for-crimea-and-sevastopol-fact-sheet.pdf (02.05.2016)
ILO – Ukraine: http://www.ilo.org/gateway/faces/home/ctryHome?locale=EN&countryCode=UKR&_adf.ctrl-state=h9pfn6wss_38 (04.05.2016)
CIA – The World Factbook Ukraine: https://www.cia.gov/library/publications/the-world-factbook/geos/up.html (04.05.2016)
Research Infrastructure Observatory: http://observatory.rich2020.eu/rich/countries/view/Ukraine (04.05.2016)
Transparency International – Corruption Index Ukraine: https://www.transparency.org/country/#UKR (04.05.2016)
United Nations: http://www.un.org/press/en/2014/ga11493.doc.htm (02.05.2016)
UNDP – Human Development Index: http://hdr.undp.org/en/composite/HDI (04.05.2016)
World Bank - Data on Ukraine: http://data.worldbank.org/country/ukraine (02.05.2016)
UN Statistics Division: http://unstats.un.org/unsd/cr/registry/regcst.asp?Cl=27 (02.05.2016)
European Patent Office (EPO) – IP rights in the EU: http://ec.europa.eu/internal_market/intellectual-property/docs/joint-report-epo-ohim-final-version_en.pdf (02.05.2016)
EPO – Online patent database: https://data.epo.org/expert-services/index-2-2-6.html (03.05.2016)
World Intellectual Property Organisation (WIPO) – The International Trademark System: http://www.wipo.int/madrid/en/ (02.05.2016)
WIPO–The International Patent System: http://www.wipo.int/pct/en/ (02.05.2016)
WIPO - http://www.wipo.int/ipstats/en/statistics/country_profile/profile.jsp?code=UA (02.05.2016)
United Nations Conference on Trade and Development (UNCTAD) – World Investment Report 2012: http://unctad.org/en/PublicationsLibrary/wir2012_embargoed_en.pdf (02.05.2016)
United Nations Industrial Development Organisation – Strategies for Regional Innovation Systems: https://www.unido.org/uploads/tx_templavoila/Strategies_for_regional_innovation_systems.pdf(02.05.2016)
Rating and Investment Information – News release on Ukraine: https://www.r-i.co.jp/eng/body/cfp/news_release_A/2016/01/news_release_2016-A-0012_01.pdf (02.05.2016)
Reuters – IMF and Ukraine: http://www.reuters.com/article/us-ukraine-crisis-imf-budget-idUSKBN0U10OE20151218 (03.05.2016)
The Economist – Ukraine gas crisis 2009: http://www.economist.com/news/briefing/21600111-reducing-europes-dependence-russian-gas-possiblebut-it-will-take-time-money-and-sustained (04.05.2016)
World Bank Group–Doing Business Report: http://www.doingbusiness.org/rankings (03.05.2016) EC – European Research Area: http://ec.europa.eu/research/era/index_en.htm (03.05.2016) EC–HORIZON 2020: https://ec.europa.eu/programmes/horizon2020/ (03.05.2016)
EC–Innovation Union: http://ec.europa.eu/research/innovation-union/index_en.cfm (03.05.2016) EC – Erasmus Mundus Programe: http://eacea.ec.europa.eu/erasmus_mundus/ (03.05.2016)
EC–Tempus Programe: http://eacea.ec.europa.eu/tempus/ (03.05.2016)
Austria’s Cabinet of Ministries – Agreement on S&T-cooperation with Ukraine: http://www.ris.bka.gv.at/Dokumente/BgblAuth/BGBLA_2004_III_135/COO_2026_100_2_147460.pdf(03.05.2016)
Ministry of Education and Research Germany - Agreement on S&T-cooperation with Ukraine: https://www.bmbf.de/de/ukraine-368.html (03.05.2016)
Ukrainian National Statistical Service – Migration in Ukraine in January 2016: https://ukrstat.org/operativ/operativ2016/ds/mr/mr_r/mr0116_r.html (03.05.2016)
State Intellectual Property Service of Ukraine: http://sips.gov.ua/en (03.05.2016) Ukrainian Intellectual Property Insitute: http://www.uipv.org/en/ (03.05.2016)
List of Figures:
ANNEXES
Annex 1
Development of Ukrainian publications/international co-publications(UA-EU28/AC co-publications, 2003-2013 (Source = WoS+Scopus)
Annex 2
20 most involved countries in Ukraine’s international co-publications, 2003-2013 (Source = WoS+Scopus)
Annex 3
Annual output and growth from 2003 to 2013 in UA pubications and UA+EU/AC co-publications, 2003-2013 (Source = WoS+Scopus)
Annex 4
Top 10 Science Metrix fields of the most involved EU28/AC partner countries in UA co-publications, 2003-2013, part 1 (Source = WoS+Scopus)
Top 10 Science Metrix fields of the most involved EU28/AC partner countries in UA co-publications, 2003-2013, part 2 (Source = WoS+Scopus)
Free publications:
• one copy:
via EU Bookshop (http://bookshop.europa.eu);
• more than one copy or posters/maps:
from the European Union’s representations (http://ec.europa.eu/represent_en.htm); from the delegations in non-EU countries (http://eeas.europa.eu/delegations/index_en.htm); by contacting the Europe Direct service (http://europa.eu/europedirect/index_en.htm) or calling 00 800 6 7 8 9 10 11 (freephone number from anywhere in the EU) (*).
(*) The information given is free, as are most calls (though some operators, phone boxes or hotels may charge you).
Priced publications:
• via EU Bookshop (http://bookshop.europa.eu).
The Horizon 2020 Policy Support Facility (PSF) has been set up by the Directorate-General for Research & Innovation (DG RTD) of the European Commission under the EU
Framework Programme for Research & Innovation ‘Horizon 2020’.
It supports Member States and countries associated to Horizon 2020 in reforming their national science, technology and innovation systems.
This report summarises evidence on the situation in the field of science, technology and innovation (STI) in Ukraine and provides a background for the PSF Peer Review of
Ukraine’s research and innovation system, conducted in 2016 by a panel of independent experts and national peers.
Studies and reports
ISBN: 978-92-79-59353-6
|
||||||||||||||||||||||||||||||||||||||||||||||||||||||||||||||||||||||||||||||||||||||||||||||||||||||||||||||||||||||||||||||||||||||||||||||||||||||||||||||||||||||||||||||||||||||||||||||||||||||||||||||||||||||||||||||||||||||||||||||||||||||||||||||||||||||||||||||||||||||||||||||||||||||||||||||||||||||||||||||||||||||||||||||||||||||||||||||||||||||||||||||||||||||||||||||||||||||||||||||||||||||||||||||||||||||||||||||||||||||||||||||||||||||||||||||||||||||||||||||||||||||||||||||||||||||||||||||||||||||||||||||||||||||||||||||||||||||||||||||||||||||||||||||||||||||||||||||||||||||||||||||||||||||||||||||||||||||||||||||||||||||||||||||||||||||||||||||||||||||||||||||||||||||||||||||||||||||||||||||||||||||||||||||||||||||||||||||||||||||||||||||||||||||||||||||||||||||||||||||||||||||||||||||||||||||||||||||||||||||||||||||||||||||||||||||||||||||||||||||||||||||||||||||||||||||||||||||||||||||||||||||||||||||||||||||||||||||||||||||||||||||||||||||||||||||||||||||||||||||
|
|
Последнее изменение этой страницы: 2017-01-24; просмотров: 31; Нарушение авторского права страницы; Мы поможем в написании вашей работы! infopedia.su Все материалы представленные на сайте исключительно с целью ознакомления читателями и не преследуют коммерческих целей или нарушение авторских прав. Обратная связь - 3.16.41.142 (0.199 с.) |


 How to obtain EU publications
 KI-AX-16-002-EN-N