Заглавная страница Избранные статьи Случайная статья Познавательные статьи Новые добавления Обратная связь КАТЕГОРИИ: ТОП 10 на сайте Приготовление дезинфицирующих растворов различной концентрацииТехника нижней прямой подачи мяча. Франко-прусская война (причины и последствия) Организация работы процедурного кабинета Смысловое и механическое запоминание, их место и роль в усвоении знаний Коммуникативные барьеры и пути их преодоления Обработка изделий медицинского назначения многократного применения Образцы текста публицистического стиля Четыре типа изменения баланса Задачи с ответами для Всероссийской олимпиады по праву 
Мы поможем в написании ваших работ! ЗНАЕТЕ ЛИ ВЫ?
Влияние общества на человека
Приготовление дезинфицирующих растворов различной концентрации Практические работы по географии для 6 класса Организация работы процедурного кабинета Изменения в неживой природе осенью Уборка процедурного кабинета Сольфеджио. Все правила по сольфеджио Балочные системы. Определение реакций опор и моментов защемления |
Graph 2. Attitude to risk in education of our respondents ⇐ ПредыдущаяСтр 2 из 2
As we can see from the graph in both groups of respondents are risk lovers, so they are ready to pass exam despite on the probability receive lower mark or even fail an exam. The most interesting thing is that less hardworking students are riskier (69,57% vs 59,42%), so they prefer challenges in their study. One of the most interesting thing that half of KSE who participated in this survey are risk averse, so they have chosen B-grade with certainty.
Graph 3. Attitude of our respondents to risk with money
We can see that major share of our respondents shows risk averse behavior toward receiving money but they become risk seekers in the case of losing money. This is an evidence that people try to minimize they losses and become lose averse. In contrast, approximately 4% of respondents shows opposite behavior. Third part of our sample is risk lovers.
During our analysis we have found interesting inconsistency in self-evaluation of responses and their behavior (chose between different options).
Graph 4. Violation of consistency in behavior among risk seekers responds
Graph 5. Violation of consistency in behavior among risk averse responds
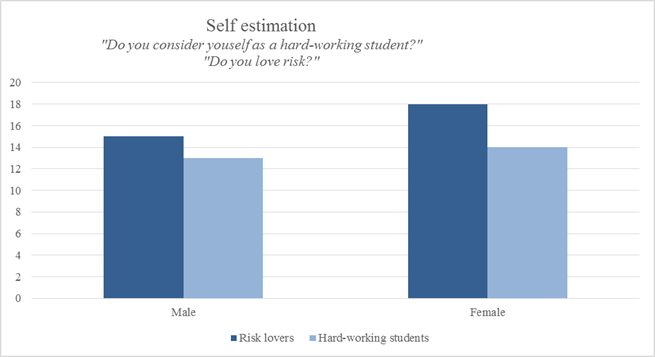
Random subsample (60 observations) To make our estimation more accurate and comparable we decided to exclude a random sample (of 60 respondents) from obtained data, in order to perform comparison between two examined group, that include different sample range – 200 respondents participated in the first questionnaire and only 30 – in the second. We have randomly chosen 30 responders from the 200 observation Self-estimation According to students’ responses higher amount of girls consider themselves as risk-lovers and hard-working students. We decided to check whether it is true. Table 4. Risk type of responder by gender
Graph 6. Risk type of responder by self-estimation.
In fact, women are more risk-averse than men in case of possible gains and more risk-seeking about losses. However, in case with grades females are more risk-seeking than males. Graph 7. Risk types of responder by gender
Results As a result, slightly different questions showed us significant differences in risk seeking and risk aversion. Table 5. Difference between questionnaires.
In the first case of possible winnings, both questionnaires show a high level of risk-averseness. Moreover, the level of risk-averseness becomes higher as values of possible winning increase. When people were suggested to get 10$ with a probability 100%, 27% of people were ready for risk to win more. When people were suggested to get 100$ for sure, 23% of people were ready to risk in order to obtain more. In the case when risk is not related to money overall level of risk-seeking is much higher. Nevertheless, there is another interesting issue. When students were suggested to either get grade B for an exam with a probability 100% or grades A, B, C with equal probabilities, half of student were ready to risk in order to get higher grade. However, as soon as 1% probability of getting F occurred, amount of students who were ready to risk considerably decreased, so that only 40% of students would take an exam instead of getting B for sure. Another interesting issue to consider is risk seeking in case of losses. This is kind of phenomena that people demonstrate risk aversion in some situations, and risk seeking in others. Usually people are risk-averse about gains and risk-seeking about losses. Results that we have obtained from students prove this assumption. The level of risk seeking in case of possible losses money is pretty high. However, as values of possible losses increased risk-seeking decreases.
Graph 8. Difference in answers between two groups of responders.
Conclusions Results of our survey did not confirm our first initial hypothesis that females are more risk-averse than males. Based on the analysis of responds obtained from our sample we can see that on average males are more risk-averse than females. However, we received confirmation for our second hypothesis, that KSE students and graduates on average are more risk-seeking in comparison to student and graduates of other universities. In addition, our investigation shows that KSE students on average are more risk-averse in comparison to responders without high education. Female students from KSE showed on average the highest level of risk-seeking. On a counterweight male KSE students showed the highest level of risk-aversion. It seems a bit controversial and could be explained by small sample and some kind of biased selection. Our results are just informative and could not be not spread for the whole population. The sample was small and non-representative and we guess, that it was bias, because the survey was performed through social networks. Although the risk-aversion depend on many factors and age plays the crucial role. Taking into account that we were investigated main age category of 20-30 years with high education we can suppose that it was one of the reasons, why the initial hypothesis of woman higher risk-averseness was not confirmed.
|
|||||||||||||||||||||||||||||
|
|
Последнее изменение этой страницы: 2016-08-10; просмотров: 105; Нарушение авторского права страницы; Мы поможем в написании вашей работы! infopedia.su Все материалы представленные на сайте исключительно с целью ознакомления читателями и не преследуют коммерческих целей или нарушение авторских прав. Обратная связь - 18.224.44.108 (0.006 с.) |